
Football Player Props in Europe: The Complete Guide
Football player props explained: the 11 markets, how lines and odds work, how bets settle, what drives each stat, and a research checklist, with 2025/26 data.
- #player-props
- #beginner
- #markets
- #settlement
- #strategy
Football player props are bets on what one player does in a match, not on who wins it: Over 1.5 shots on target, 1+ foul committed, to be booked. They settle on the stat your bookmaker’s data provider records. What drives them is mostly the player’s role, his minutes and his direct opponent, which is why the research looks different from match betting.
11
player prop markets covered here, in 5 groups
2,097
matches analysed across 7 European competitions
Fobal data, 2025/26
49.8%
of forwards’ starts with 1+ shot on target (defenders: 14.7%)
Fobal data, 2025/26
27.2%
of matchday-squad players never got on the pitch
Fobal data, 2025/26
This guide is the hub for our player props series. Each section gives you the essentials and links to the guide that covers it in full.
What is a player prop?
A player prop (short for “proposition”) is a bet on a single player’s statistical output in one match. Three formats cover almost everything you will see:
- Over/Under a line. “Over 1.5 shots on target” wins with 2 or more.
- Yes/No. “To be booked” or “anytime goalscorer”: he either does it or he doesn’t.
- Milestones in a bet builder. “2+ fouls won” combined with other selections from the same match.
Only the player’s own numbers count. A team can have 20 shots and lose your bet if your striker had none of them on target.
Which player prop markets are there?
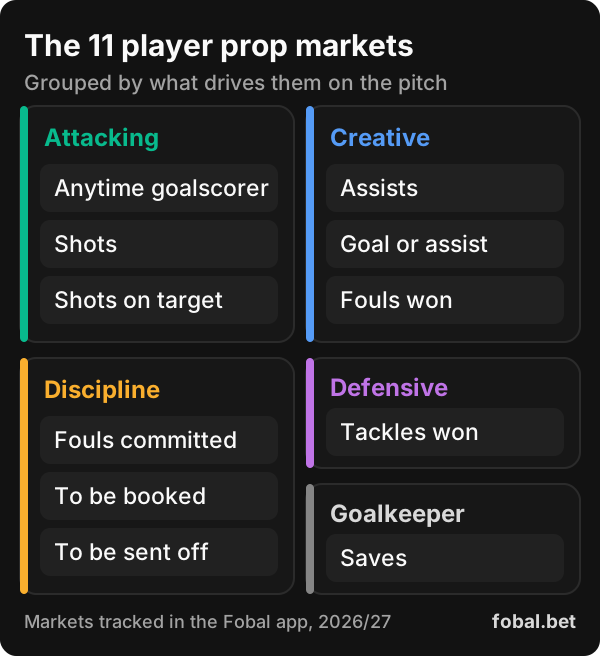
Fobal tracks 11 player markets. They fall into five groups by what drives them on the pitch, as the market map at the top of this page shows: attacking, creative, discipline, defensive and goalkeeper. Saves sit in a group of their own: they depend on how many shots the opponent puts on target. Not every bookmaker offers every market for every match.
The definitions matter more than the names. The table gives how often a starter records at least one, what each market counts and what moves it.
| Market | Starts with 1+ | What counts | Key drivers |
|---|---|---|---|
| Anytime goalscorer | 9.4% | Goals by the player (own goals excluded) | Role, penalties, opponent |
| Assists | 7.2% | The final pass before a teammate scores | Set pieces, teammates’ finishing |
| Goal or assist | 15.5% | Goals plus assists | Attacking role, minutes |
| Shots | 51.1% | Every attempt, including blocked ones | Role, minutes, game state |
| Shots on target | 25.3% | Goals, saved shots and shots cleared by the last defender | Shot volume, shot quality |
| Tackles won | 48.8% | Tackles that win the ball back | Role, opponent’s possession |
| Fouls committed | 56.1% | Fouls given by the referee | Direct opponent, role |
| Fouls won | 53.1% | Free kicks or penalties won | Dribbling, direct opponent |
| To be booked | 14.4% | A card shown to the player (check how a straight red is treated) | Role, fouls, game state |
| To be sent off | under 1% | A straight red or a second yellow | Rare, priced long |
| Goalkeeper saves | 92.6% (keepers) | Saves made by the keeper | Opponent’s shots on target |
Source: Fobal data, 2025/26, Premier League, La Liga, Serie A, Bundesliga, Ligue 1, Champions League and Europa League, 46,126 starts. “Starts with 1+” is the share of starts in which the player recorded at least one.
Two definitions trip people up. A shot blocked by an outfield defender is a shot, but not a shot on target: 27.1% of all player shots in 2025/26 were blocked. And “tackles” usually means tackles won: Opta defines a tackle won as one where the tackler or a teammate regains possession. Our shots vs shots on target guide covers the shot definitions in full.
Attacking: goals, shots, shots on target
These are volume markets, and volume comes from position. Forwards average 2.36 shots and 0.92 shots on target per 90, against 0.59 and 0.18 for defenders. About 35% of all shots hit the target, so shots on target is the narrower, lower-scoring market. Anytime goalscorer is the hardest of the three to land: even forwards scored in 21.7% of their starts.
Creative: assists, goal or assist, fouls won
Assists depend on someone else finishing, which makes them one of the hardest markets to forecast: forwards recorded one in 11.0% of starts, midfielders in 8.7%. Goal or assist roughly doubles the chance for attackers (29.9% of forwards’ starts). Fouls won belongs in this group because it rewards players who carry the ball: wingers lead at 1.58 fouls won per 90 on the left and 1.50 on the right.
Discipline: fouls committed, booked, sent off
Midfielders commit at least one foul in 65.0% of their starts, the highest of any position. Bookings are far less common than fouls: a starter is booked in 14.4% of starts, and the most-booked role, the defensive midfielder, in 18.9%. Red cards are rare: 0.75% of starters were sent off, which is why “to be sent off” is priced so long.
Defensive and goalkeeper: tackles won, saves
Per 90, midfielders win slightly more tackles (1.12) than defenders (1.06), and both groups win at least one in about 59% of starts. Saves are a goalkeeper market that tracks the opponent: keepers made 2.97 saves per 90, and 1+ save in 92.6% of their starts, so the lines worth studying sit higher.
How do player prop lines and odds work?
Every prop has four parts: a player, a market, a line and a price.
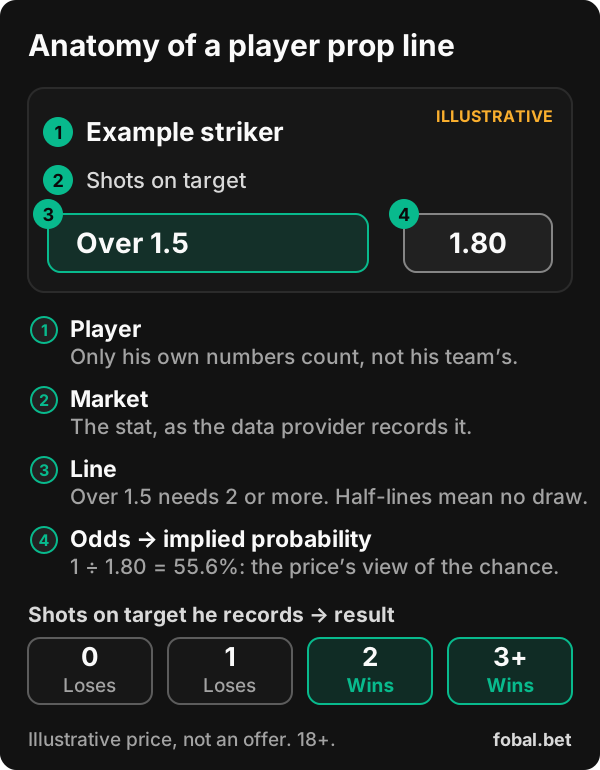
The line sits on a half-point so the bet can’t finish level. Over 0.5 means “at least one”, Over 1.5 means “at least two”, and so on. Bookmakers often offer several lines for the same player, each at a different price.
Each step up a line is steep. Forwards had at least one shot on target in 49.8% of their starts, but at least two in only 17.6%. Over 0.5 and Over 1.5 on the same striker are very different bets, and the price should reflect that.
The odds tell you how likely the bookmaker thinks it is. With decimal odds, divide 1 by the price:
- 1.80 implies 1 ÷ 1.80 = 55.6%
- 2.50 implies 40.0%
- 1.40 implies 71.4%
The margin is built in. Suppose (illustrative prices) Over 0.5 shots on target is 1.80 and Under 0.5 is 1.95. The implied probabilities are 55.6% and 51.3%, which add up to 106.9%. The extra 6.9% is the bookmaker’s margin, so a price can’t be judged on its own. You need your own estimate. If you think the player has a 60% chance, the fair price is 1 ÷ 0.60 = 1.67, and anything below that is a price you shouldn’t take.
How are player props settled?
Three rules decide most outcomes. Our guide on how player props are settled, with starters, subs and voids covers the edge cases.
- The data provider decides, not the TV graphic. Sky Bet, for example, states that its player stat markets are resulted against Opta data. Opta’s own definitions say which shots count as on target and which count as blocked: shots stopped by a last-line defender count as on target.
- No appearance usually means void. Sky Bet’s rule is that if the player does not take part in the match, bets are void. Once he comes on, even for a minute, the bet stands. Some markets at some bookmakers need the player to start. And if he is substituted, the big UK bookmakers now pass the bet to his replacement on marked markets: bet365’s Sub On Play On, Super Sub at Sky Bet and Paddy Power, and Betfair’s Safe Sub.
- 90 minutes plus stoppage time. Sky Bet’s football rules settle markets on the result after 90 minutes’ play unless otherwise specified, and its general rules count time added on for stoppages as part of those 90. bet365 is the main exception: player bets that have not yet won at 90 minutes run on through extra time, so check before a cup tie.
The void rule is not a technicality. In 2025/26, 27.2% of matchday-squad players never got on the pitch, and 56.3% of named substitutes stayed on the bench. The other risk is the cameo: 29.3% of substitute appearances lasted 10 minutes or less, and only 6.6% of those produced a shot on target. A bet on a bench player who comes on in the 85th minute is live, and very likely lost. Early withdrawals of starters are rarer than many bettors fear: only 0.52% of starters went off before the 30th minute, and 84% of those were injuries.
What drives each player prop market?
Four inputs explain most of the variation between players: role, minutes, matchup and game state.
Role
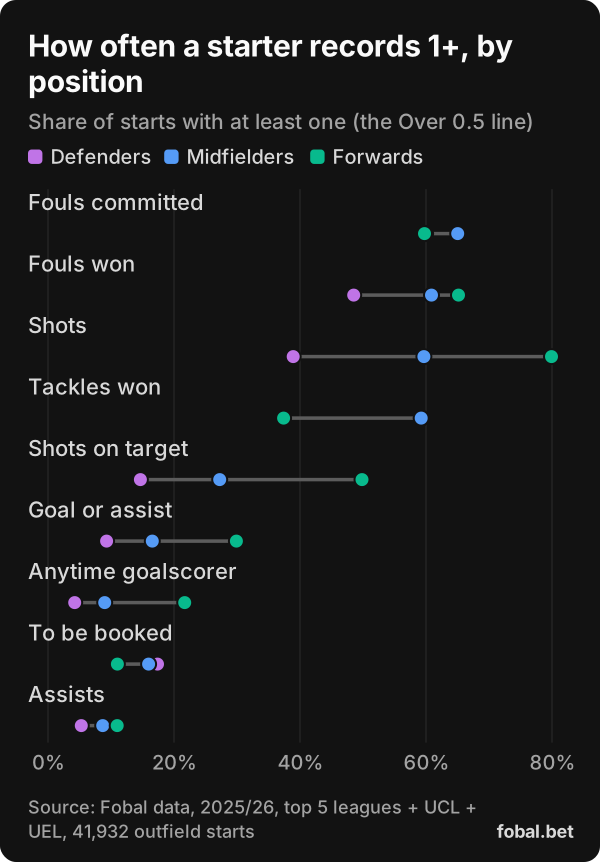
Position sets the baseline. Forwards average 0.92 shots on target per 90, midfielders 0.40 and defenders 0.18. Forwards record at least one in 49.8% of their starts. Defenders do it in 14.7%. Use the chart above as your prior before you look at any individual player: a defender priced as if he were a forward is a red flag. Our shots on target guide breaks this down by detailed role.
Minutes
Per-90 rates only become a projection once you multiply by the minutes the player will actually get. Of starters, 61.1% are credited with the full 90. For forwards it is 34.2%, and they average 76.6 minutes. A striker who comes off on 65 minutes loses a quarter of his chances to land the line. Selection is the other half of the question. Regular starters started their club’s next match 87.9% of the time after starting, but only 62.7% of the time after being left out, so one benching is a signal worth taking seriously. The method is in our guide to expected minutes for player props.
Matchup
Fouls and tackles are duels, so the direct opponent matters. Wingers win the most fouls (1.58 per 90 for left wingers), and the team effect is large: teams that won 14 or more fouls saw their opponents collect 2.47 yellow cards on average, against 1.23 when they won 0 to 7. That is a team-level link, not proof about any one player. See fouls committed and fouls won: betting the matchup.
Game state
The score changes behaviour. Cards cluster late: 67.5% of player cards came in the second half, and 35.7% from the 76th minute onwards. A team chasing a game takes more shots, while a team protecting a lead commits more fouls. Our player to be booked guide covers card timing in detail.
Which leagues does this cover?
The data in this series covers the 2025/26 season of the Premier League, La Liga, Serie A, Bundesliga, Ligue 1, and the Champions League and Europa League from the league stage to the semi-finals: 2,097 matches. League identity changes the baseline more than most bettors expect.
| Competition | Shots | Shots on target | Fouls | Cards |
|---|---|---|---|---|
| Premier League | 24.9 | 8.4 | 21.6 | 3.92 |
| La Liga | 25.0 | 8.6 | 24.9 | 4.61 |
| Serie A | 24.6 | 8.1 | 25.4 | 3.83 |
| Bundesliga | 26.5 | 9.6 | 20.8 | 3.87 |
| Ligue 1 | 24.9 | 8.7 | 24.1 | 3.92 |
| Champions League | 27.3 | 10.4 | 22.2 | 3.55 |
| Europa League | 25.2 | 9.1 | 25.2 | 4.19 |
| All 7 | 25.3 | 8.8 | 23.5 | 4.01 |
Per match, both teams combined. Source: Fobal data, 2025/26, 2,097 matches (Champions League and Europa League: league stage to semi-finals).
One example of why the data beats the stereotype: Serie A has the most fouls per match, yet it has the fewest yellow cards per foul. La Liga leads for cards at 4.61 per match, and the Champions League is lowest at 3.55. The full comparison is in which European league is best for player props.
How do you research a player prop?
A repeatable routine beats a gut feeling. Work through these steps in order:
- Read the market rules. Which data provider, which void rule, does a red card count as a booking?
- Confirm the role. Is he starting, and in which position? A full-back moved to wing-back is a different player for fouls and shots.
- Estimate his minutes. Regular 90, or usually off around the hour? Is there a midweek European match?
- Look at the hit rate on the exact line, over at least 10 matches, not just the last 5.
- Compare it with the position baseline in the chart above. Large gaps need a reason.
- Check the matchup. The opponent’s style, the direct opponent, and the league’s baseline.
- Think about game state. Favourite or underdog? Likely to be chasing or protecting a lead?
- Convert the price to a probability and compare it with your own estimate. No gap, no bet.
- Stake within a fixed budget, and record the bet so you can review your process.
Steps 4 and 5 are where a dedicated tool saves time: in the Fobal app each line shows the player’s last 5, last 10, head-to-head and season hit rates next to the price. How those figures are built is set out in how Fobal calculates hit rates and picks.
What are the most common player prop mistakes?
- Treating a hit rate as a probability. Ten matches is a small sample. Players with a shot on target in 8 of their last 10 starts had one in 66.1% of their next 10, not 80% (Fobal data, 2025/26). Read why “8 of the last 10” can mislead you.
- Ignoring minutes. A per-90 rate from a player who usually comes off on the hour overstates what he will do.
- Confusing shots with shots on target. Blocked shots count for one market and not the other.
- Betting the league stereotype. Serie A is not the card league it is often assumed to be.
- Skipping the void rule. A substitute who comes on late keeps the bet alive with little time to win it.
- Forgetting the margin. A good player at a short price can still be a poor bet.
- Chasing losses. Props are high-variance. See responsible betting for player prop bettors for limits that work.
Player props vs match markets: what’s different?
| Player props | Match markets (1X2, goals totals) | |
|---|---|---|
| What you bet on | One player’s statistic | The team or match outcome |
| What matters most | Role, minutes, direct opponent | Team strength, form, tactics |
| Team news | Decisive: a benching voids or kills the bet | Important, but one player rarely decides it |
| Void risk | Real: the player may not appear | Very low |
| Variance | High: one player, small counts | Lower: aggregates across 22 players |
| Bet builders | Common, and legs are often linked | Usually single selections |
Linked legs matter in bet builders. A striker’s shots on target and his team’s goals tend to move together, so combining them is not the same as two independent bets. Bookmakers price that link in.
The guides in this series
- How player props are settled: Opta definitions, starters, subs and voids
- Shots vs shots on target: what counts and how to bet each
- Player to be booked: how cards really happen
- Fouls committed and fouls won: betting the matchup
- Why “hit in 8 of the last 10” can mislead you
- Expected minutes: the most underrated input in player props
- How Fobal calculates hit rates (and picks)
- Which European league is best for player props?
- Responsible betting for player prop bettors
Frequently asked questions
What is a player prop in football?
A player prop is a bet on an individual player’s statistic in a match, such as shots on target, fouls committed, tackles won or being booked, rather than on the result. Most are priced as Over/Under a half-point line or as Yes/No, and they settle on the statistic recorded by the bookmaker’s data provider.
Do player props void if the player doesn’t play?
At most bookmakers a player prop is void if the player takes no part in the match, and it stands once he comes on, even for one minute. Some markets and bookmakers require the player to start. Rules differ, so read the football rules of the bookmaker you use before you bet.
What does Over 1.5 shots on target mean?
Over 1.5 wins if the player records 2 or more shots on target and loses with 0 or 1. Lines are set on half-points so a bet cannot finish level. Under 1.5 is the opposite: it wins with 0 or 1.
How do I turn odds into a probability?
Divide 1 by the decimal odds. Odds of 1.80 imply a 55.6% chance. Add up the implied probabilities of the Over and the Under and the total is above 100%: the excess is the bookmaker’s margin.
Which player prop markets land most often?
At the lowest line (1 or more), fouls committed, fouls won, shots and tackles won land in roughly half of all starts or more, while anytime goalscorer lands in 9.4% and to be booked in 14.4% (Fobal data, 2025/26, top 5 leagues plus Champions League and Europa League). How often a market lands says nothing about whether the price is fair.
Are player props easier to win than match bets?
No. Player props depend on one player’s minutes and role, so they carry more variance and more void risk than match markets. They reward research on team news and matchups, but no market is a sure thing. Set a budget before you bet.