
Per 90 Stats Betting: Why Expected Minutes Matter Most
Only 34% of forwards' starts last 90 minutes. Learn to turn per 90 stats into a player prop projection with expected minutes, using Fobal's 2025/26 data.
- #expected-minutes
- #per-90
- #rotation
- #substitutions
- #projections
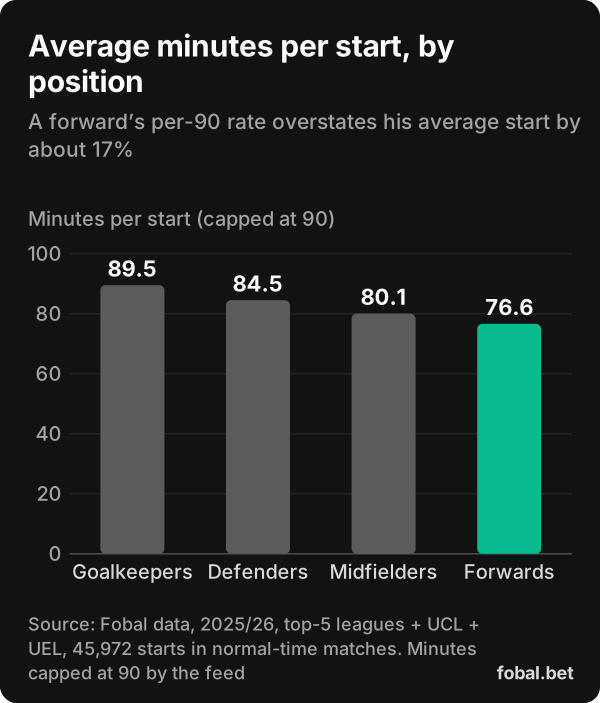
Answer first: per 90 stats only become a betting projection once you multiply them by expected minutes. In Fobal’s 2025/26 data, only 34% of forwards’ starts lasted 90 minutes. An average forward’s 0.92 shots on target per 90 is really about 0.79 per start. Estimate minutes first, then apply the rate.
34.2%
of forwards’ starts last the full 90 (all starters: 61.1%)
Fobal, 2025/26, 7 comps
72
median minute a substituted starter goes off
76.6
average minutes per start for forwards
87.9%
chance a regular starter starts again after starting
Most prop research starts with a rate: shots per 90, fouls per 90, tackles per 90. The rate gets the attention, but the minutes decide how much of it the player has time to produce. This guide shows how long players really stay on, how to estimate minutes, and how to turn the two into one number.
What is a per-90 stat, and why isn’t it a forecast?
A per-90 rate is a player’s total for a stat divided by his minutes, multiplied by 90. It makes a 60-minute winger and a 90-minute centre-back comparable.
The catch is in the name: it assumes 90 minutes. A prop is settled on what the player does in this match, in whatever time he gets. A forward with 0.92 shots on target per 90 who goes off at the hour has had two-thirds of the time to get there.
Per-90 rates built on short substitute appearances are also unstable. A few 10-minute cameos can produce a huge rate that full matches never repeat. For the same reason, our study of why “8 of the last 10” hit rates mislead used starts only.
How long do starters actually play?
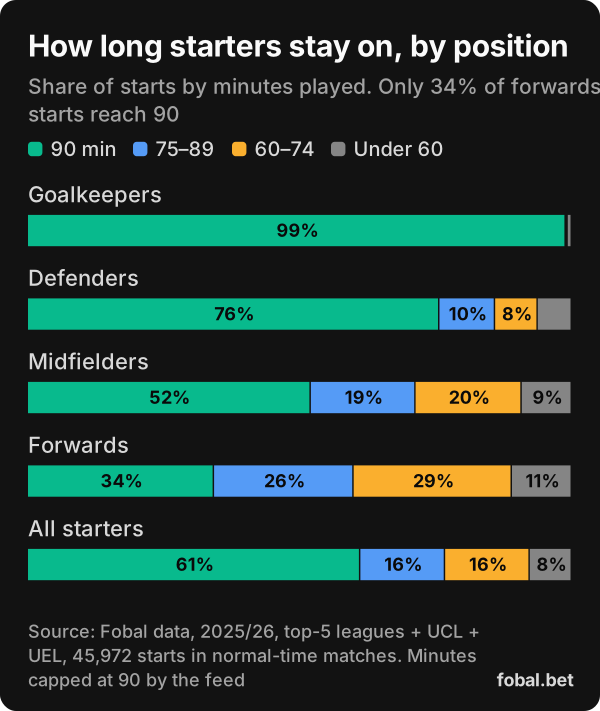
| Position | Plays 90 | Avg minutes | Off before 75′ | Starts |
|---|---|---|---|---|
| Goalkeepers | 98.9% | 89.5 | 1.0% | 4,180 |
| Defenders | 75.6% | 84.5 | 14.1% | 17,636 |
| Midfielders | 52.0% | 80.1 | 28.7% | 13,231 |
| Forwards | 34.2% | 76.6 | 40.1% | 10,925 |
| All starters | 61.1% | 81.8 | 23.3% | 45,972 |
Two-thirds of forwards’ starts end early, and four in ten end before minute 75. That is the position whose markets (shots, shots on target, goals, fouls won) are bet the most.
When do managers make their substitutions?
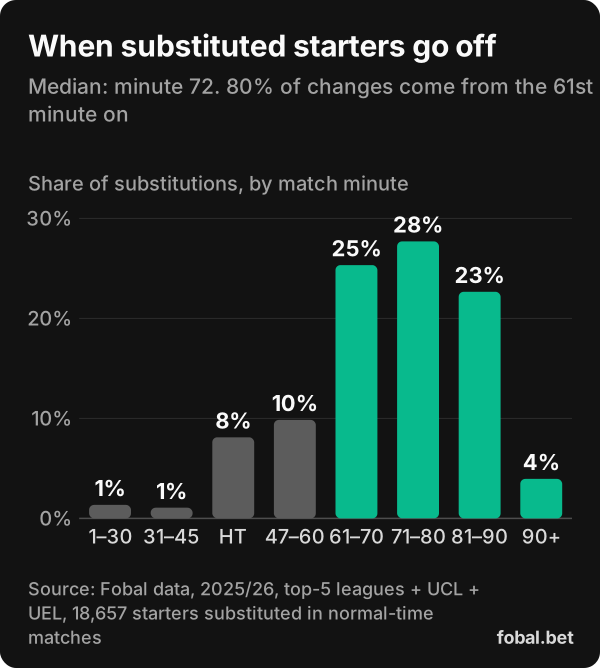
- The median substituted starter goes off at minute 72. The figure is the same for forwards and midfielders (72) and almost the same for defenders (73).
- 79.6% of these substitutions come from the 61st minute on. 8.1% happen at half-time.
- Only 1.4% come in the first half-hour, and 85% of those are flagged as injury substitutions. Early withdrawals are rare and mostly forced.
Substitutes who come on play a median of 18 minutes (mean 19.7), and 29.3% of substitute appearances last 10 minutes or fewer.
How do you turn per-90 into a projection?
The formula is simple:
Projection = per-90 rate × expected minutes ÷ 90
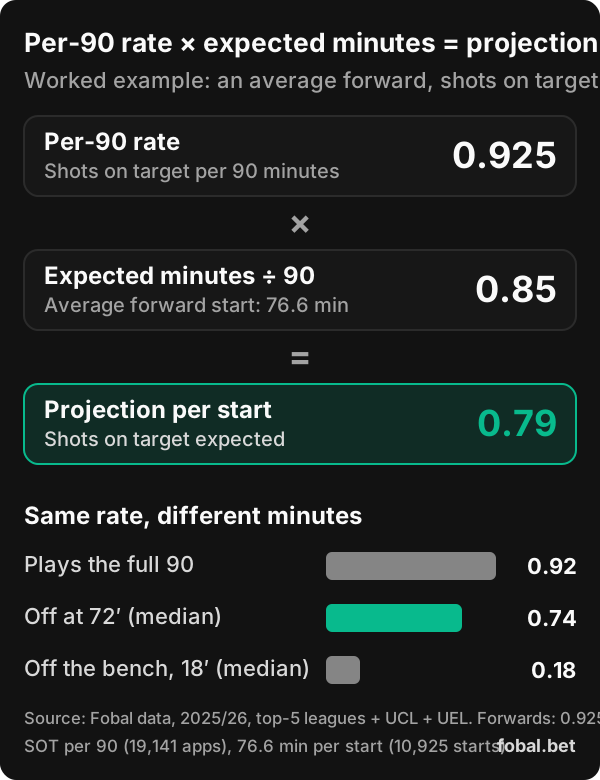
Take the average forward in 2025/26: 0.925 shots on target per 90 (0.92 to two decimals) and 76.6 minutes per start. 0.925 × 76.6 ÷ 90 = 0.79 shots on target per start. Using the raw per-90 figure would overstate him by more than 17%.
The same player at the same rate is worth 0.92 if he plays the full 90, 0.74 if he goes off at the median minute 72, and 0.18 from an 18-minute substitute appearance.
A projection is an average, not a probability. Shots arrive in clusters: some matches produce three, many produce none. Across all forwards’ starts in 2025/26, 49.8% had at least one shot on target. A simple Poisson conversion of 0.79 would suggest about 55%, so treat that kind of conversion as a rough upper guide. Our shots on target betting guide covers the distribution in detail.
Which markets are most sensitive to minutes?
Every count market scales with time on the pitch, but not equally:
| Market | How minutes bite | What to check |
|---|---|---|
| Shots, shots on target, fouls won | Roughly in proportion to minutes | The player’s usual exit minute |
| Higher lines (2+ shots, 2+ fouls) | More than in proportion: the extra events need extra time | Whether he regularly plays 80+ |
| Player to be booked | Cards cluster late, so an early exit cuts the risk sharply | Whether he finishes matches |
| Goalkeeper saves | Barely: 98.9% of keepers’ starts last 90 | Only whether he starts |
Cards are the clearest case. 35.7% of player cards in 2025/26 came from minute 76 onwards, stoppage time included. A midfielder who is routinely replaced at minute 72 misses that whole window, so his booking risk per match is lower than his per-90 rate suggests. Our player to be booked guide looks at card timing in detail.
Higher lines need even more care. A player who averages one shot on target per full match needs most of the match to get a second one. Cutting his minutes by a fifth cuts his projection by a fifth, but it cuts his chance of reaching 2+ by more than that. A simple Poisson model shows how much, for a player averaging 1.0 shot on target per 90 who goes off at the median minute of 72 (20% fewer minutes):
| Line | Plays 90 | Off at minute 72 | Relative drop |
|---|---|---|---|
| 1+ shot on target | 63.2% | 55.1% | −13% |
| 2+ shots on target | 26.4% | 19.1% | −28% |
| 3+ shots on target | 8.0% | 4.7% | −41% |
Maths, not data: a Poisson model with a mean of 1.0 per 90, scaled to 0.8 for 72 minutes. Real shot counts are clumpier, as the 49.8% example above shows, so read the pattern rather than the exact figures.
The same 20% cut costs a 1+ bet about an eighth of its chance, a 2+ bet more than a quarter and a 3+ bet two-fifths. A second or third event needs time, so the higher the line, the more an early exit hurts. If you expect a player to come off early, the over on his 0.5 line can survive; the over on 1.5 or 2.5 rarely does.
How do bookmaker lines assume minutes?
A prop line is priced for a typical match, which includes a typical exit. Two situations break that assumption:
- Minutes go down. The forward who normally plays 85 minutes is coming back from injury, or the manager has started rotating him at the hour. The line may still reflect his usual role.
- Minutes go up. A player who has been subbed at 60–65 every week is suddenly the only fit striker. His rate hasn’t changed, but his time on the pitch has.
The second case is where minutes analysis earns its keep. Rates are public and widely watched. A change in expected minutes, picked up from team news or a manager’s habits, can move the true projection by 20% or more before any rate does.
How much do rotation and the fixture list matter?
Regular starters are sticky. Among 635 players who started at least 70% of their club’s matches, 87.9% started the next match after starting one. After being left out, only 62.7% started the next one. A player who was dropped last time is a genuine minutes risk.
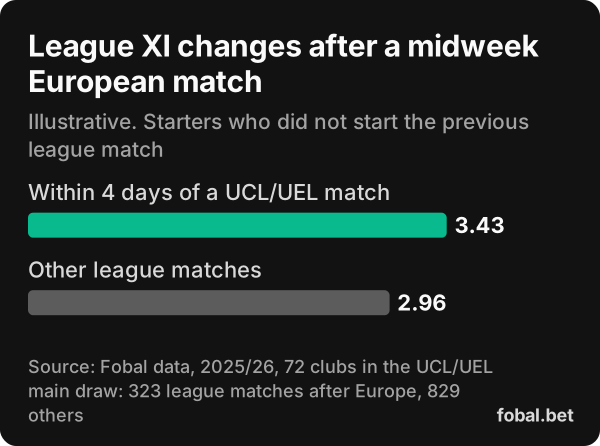
European weeks add rotation, but less than many assume. Clubs whose previous match was a Champions League or Europa League game up to 4 days earlier made 3.43 league XI changes on average, against 2.96 otherwise. League regulars started 81.3% of those post-Europe league matches, against 82.9% of the rest. The effect is small and the comparison is uncontrolled, so treat it as illustrative: a nudge to check team news, not a rule to fade every starter.
Cup ties, international breaks and the run-in work the same way. The question is always the same: does this match change how long this player is likely to play?
What if he plays less than expected?
Minutes risk and void risk are different things. If a player doesn’t feature at all, the bet is often void, but rules on non-starters, late withdrawals and substitutes differ between bookmakers. Our guide to how player props are settled covers the common cases. Always check your own bookmaker’s rules.
What a void never covers is the player who starts and goes off at minute 55 with no shot. That bet usually stands, and it loses. That is the minutes risk you price yourself.
In the Fobal app, each player’s form chart shows the minutes behind every match and flags substitute appearances, which makes a change in role easy to spot.
Checklist: estimating expected minutes
- Start with the position baseline. Average minutes per start: goalkeepers 89.5, defenders 84.5, midfielders 80.1, forwards 76.6.
- Adjust for the player’s own pattern. How often is he substituted, and when? A forward who always goes off around 65 is not an average forward.
- Check whether he started last time. Regular starters started again 87.9% of the time after starting, but 62.7% after being left out.
- Read the fixture list. A European match within 4 days, a cup tie or an international break raises rotation risk a little.
- Read the injury news. Players returning from injury are often managed for their first few matches.
- Wait for the confirmed line-up when you can. It removes the biggest minutes risk: not starting.
- Multiply last. Projection = per-90 rate × expected minutes ÷ 90. Then compare it with the line and the odds.
How we measured this
Data: Fobal’s 2025/26 database covering the Premier League, La Liga, Serie A, Bundesliga, Ligue 1 and the Champions League and Europa League main draws. Minutes analyses use normal-time matches only, so 120-minute games don’t distort them. The feed caps minutes at 90. Positions come from each player’s detailed season role, with wingers counted as forwards. A regular starter started at least 70% of his club’s matches over a span of 20+ matches. The European rotation comparison is descriptive and labelled illustrative. Per-90 figures pool all minutes played by the position group. For the markets these rates feed, see our complete guide to football player props.
Frequently asked questions
What does per 90 mean in football stats?
Per 90 is a player’s total for a stat divided by his minutes played, multiplied by 90. It puts players with different playing time on the same scale, for example shots on target per 90 minutes.
How do you use per 90 stats for player props?
Multiply the per-90 rate by the minutes you expect the player to play, divided by 90. An average forward in 2025/26 had 0.92 shots on target per 90 (0.925 before rounding) and averaged 76.6 minutes per start, which projects to about 0.79 shots on target per start.
When do football managers usually make substitutions?
In Fobal’s 2025/26 data, substituted starters went off at a median of minute 72. 79.6% of those substitutions came from the 61st minute onwards and 8.1% at half-time.
Do teams rotate after European matches?
A little. Clubs that played a Champions League or Europa League match up to 4 days earlier made 3.43 changes to their league starting XI on average, against 2.96 in other league matches. Treat it as an illustrative effect, not a rule.
What happens to my player prop if the player is substituted early?
It depends on your bookmaker’s rules. Settlement for non-starters and early substitutions varies, so check the rules before you bet. Fobal’s guide to how player props are settled explains the common cases.