
Player to Be Booked: How Cards Really Happen
Player to be booked tips built on 8,389 cards: when bookings happen, which roles get carded, which leagues card most and how card bets settle.
- #cards
- #player-to-be-booked
- #discipline
- #settlement
- #la-liga
Player to be booked bets are won late and lost early. Across 2,097 matches in 2025/26, a starter was booked in 14.4% of his starts, and 67.5% of cards came after half-time. The best tips start from role (defensive midfielders and centre-backs), minutes on the pitch, the competition and the venue, not a hunch about temperament.
14.4%
of starts end with the player booked
Fobal, 2025/26, 7 competitions
35.7%
of player cards come from minute 76 onwards
18.9%
booking rate for defensive midfielders per start
4.61
cards per match in La Liga, the highest of the seven
This guide uses Fobal’s 2025/26 data for the Premier League, La Liga, Serie A, the Bundesliga, Ligue 1, the Champions League and the Europa League: 2,097 matches and 8,389 cards shown to players.
How does a player to be booked bet work?
You back a named player to receive a card during the match. At most bookmakers a straight red counts as well as a yellow. Sky Bet, for example, settles on whether the nominated player receives a yellow or red card. Once the first yellow is shown the bet is won, so a second yellow changes nothing for this market.
The details that cost people money are about who is on the pitch and when:
| Situation | Sky Bet | Kambi terms (v2.2, Sep 2026) |
|---|---|---|
| Player comes off the bench | Bet stands | Void: pre-match disciplinary bets need the player to start |
| Player doesn’t play | Void | Void |
| Card shown on the bench or after the final whistle | Doesn’t count | Doesn’t count |
| Straight red, in card totals | 1 card | 2 cards |
| Booked, then sent off, in card totals | 2 cards (the maximum) | 3 cards (the maximum) |
Sources: Sky Bet Football General Rules (player to be carded, over/under cards); Kambi Sportsbook Terms and Conditions v2.2, last updated September 2026, as published by Paf, section C13 (football) rules 5, 6 and 12. Kambi supplies the sportsbook behind a number of operators, and each publishes its own version, so check the terms of the site you actually use.
The start rule matters more than it looks. Fobal’s booking rates below are per start, which matches the Kambi rule. If your bookmaker keeps the bet alive for a substitute, remember that a 20-minute cameo carries far less card risk than a full match. Our guide to how player props are settled covers voids and substitutions in more detail.
When do players get booked?
Late. The card clock runs the opposite way to the goal-hungry first 20 minutes people imagine.
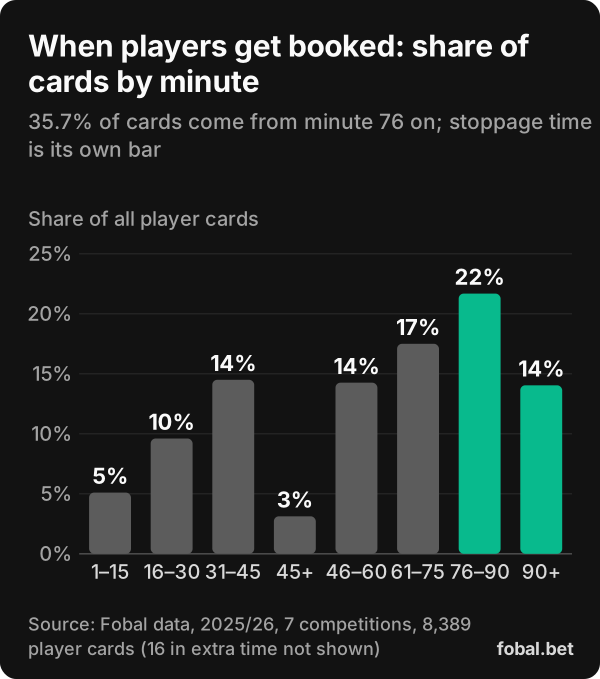
- 67.5% of player cards come in the second half (including stoppage time).
- 35.7% come from minute 76 to the final whistle.
- 14.0% come in second-half stoppage time alone, a few minutes that produce almost as many cards as the whole first 30 minutes (5.1% + 9.6%).
- Only 5.1% come in the first 15 minutes.
Why? Fatigue, tactical fouls to stop counter-attacks when a result is at stake, time-wasting, and dissent. The Laws of the Game make delaying the restart and dissent cautionable offences, and treat a foul that stops a promising attack as unsporting behaviour, which is also a caution. All three cluster at the end of tight matches.
What the late clock means for your bet
The minute a player leaves the pitch matters more than his reputation. In Fobal’s minutes data, starters who are substituted go off at a median of minute 72, and only 34.2% of forwards’ starts last the full 90 (2025/26, 7 competitions). A winger replaced in the 70th minute misses most of the window where 53% of cards are shown (61–75, 76–90 and stoppage time combined). That is a big reason forwards are booked less, and why expected minutes belong in every card bet.
Which positions get booked most?
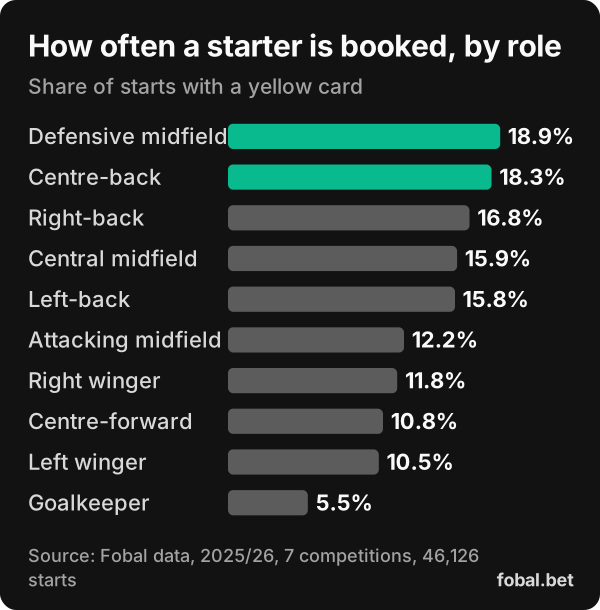
Roles that defend in transition and in their own third. Here is how often a starter was booked, by detailed role:
| Role | Yellow cards per 90 | Starts with a booking |
|---|---|---|
| Defensive midfield | 0.221 | 18.9% |
| Centre-back | 0.197 | 18.3% |
| Right-back | 0.197 | 16.8% |
| Central midfield | 0.197 | 15.9% |
| Left-back | 0.184 | 15.8% |
| Attacking midfield | 0.160 | 12.2% |
| Right winger | 0.162 | 11.8% |
| Centre-forward | 0.149 | 10.8% |
| Left winger | 0.153 | 10.5% |
| Goalkeeper | 0.056 | 5.5% |
By broad group, midfielders (0.197 per 90) and defenders (0.194) are booked at almost the same rate, forwards at 0.156 and goalkeepers at 0.056.
Read these as base rates. A booking rate of 18.9% means fair odds of about 5.3 (1 ÷ 0.189) for an average defensive midfielder, before any bookmaker margin. That figure is illustrative, not a price to chase: the point is that a “likely” card is still more likely not to happen. To beat the base rate you need a reason this player, in this match, is above average.
The most-booked players
Some players sit far above their role’s average. These are the highest yellow-card rates among the 1,000 players with at least 1,800 minutes:
| Player | Club | Yellows per 90 | Starts with a booking | Fouls per 90 |
|---|---|---|---|---|
| José Ángel Carmona | Sevilla | 0.51 | 46% | 1.74 |
| Mario Martín Rielves | Getafe | 0.48 | 36% | 2.99 |
| Alfonso Pedraza | Villarreal | 0.48 | 33% | 1.54 |
| Joelinton | Newcastle United | 0.46 | 39% | 2.26 |
| Pol Lozano | Espanyol | 0.46 | 32% | 2.65 |
| Juan Jesus | Napoli | 0.45 | 41% | 2.09 |
| Nicolás Capaldo | Hamburger SV | 0.45 | 38% | 1.39 |
| Yerson Mosquera | Wolverhampton Wanderers | 0.44 | 39% | 1.45 |
| Iñigo Ruiz de Galarreta | Athletic Club | 0.43 | 38% | 2.14 |
| Dayann Methalie | Toulouse | 0.43 | 36% | 2.72 |
Source: Fobal data, 2025/26, 7 competitions, players with 1,800+ minutes. Club = the club where he played most minutes.
Five of the top ten play in La Liga, which fits the league numbers below. Note the fouls column: Carmona and Capaldo are booked often without fouling much, so their cards come from fewer, costlier challenges or from dissent.
Do fouls lead to cards?
Yes, but loosely. Across 4,194 team-matches, teams were shown 0.162 yellow cards per foul committed, roughly one booking for every six fouls. The correlation between a team’s fouls and its own yellows in a match is 0.34: real, but far from one-to-one.
Definitions explain part of the gap. Under the Opta definitions Sky Bet settles on, a caution after the referee plays advantage doesn’t add a foul, and dissent or time-wasting bookings come with no foul at all. A player can be booked with zero fouls in his line.
The other direction matters more for betting. Teams that win 14 or more fouls see their opponents collect 2.47 yellows on average, against 1.23 when they win seven or fewer, so a defender facing a winger who draws fouls is under pressure all match. Our guide to fouls committed and fouls won shows how to read that matchup.
Which leagues show the most cards?
La Liga, clearly. Serie A, despite its reputation, is near the bottom.
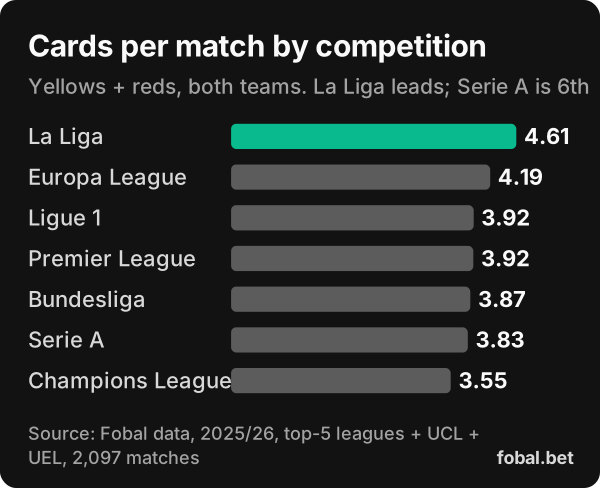
- La Liga averages 4.61 cards per match (4.33 yellows), sees a red in 23.0% of matches and a card for 91.4% of teams.
- Serie A has the most fouls of any of the seven (25.4 per match) but ranks sixth for cards at 3.83. Its referees convert fouls into bookings less often than anyone else.
- The Champions League is the calmest at 3.55 cards per match, with at least one card for 82.7% of teams.
- The Premier League sits mid-table on cards (3.92) but has the fewest reds: one in 10.5% of matches.
Across all seven, 87.4% of team-matches include at least one card for that team. Our league-by-league comparison for player props puts cards next to fouls, shots and tackles.
Are away players booked more?
Yes, in every competition we track. Away teams averaged 2.16 cards per match against 1.86 for home teams.
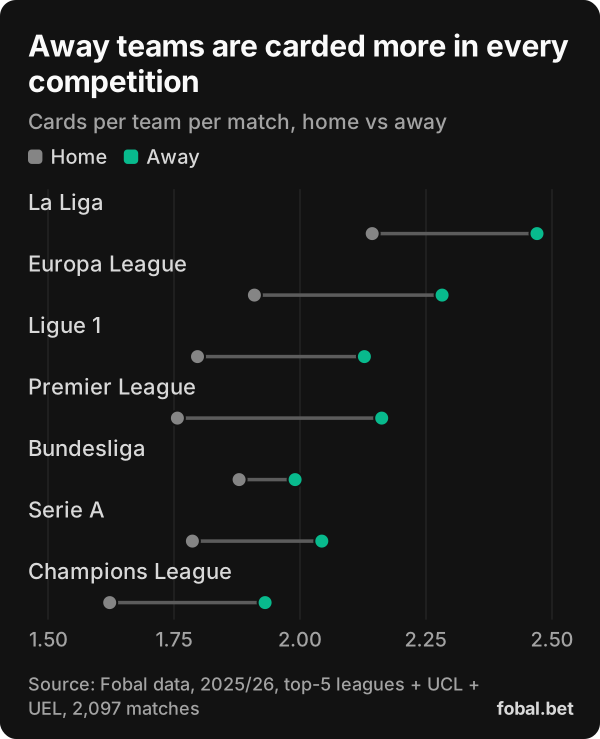
The gap is widest in the Premier League (1.76 home, 2.16 away) and narrowest in the Bundesliga (1.88 vs 1.99). Away sides tend to defend for longer and face a hostile crowd, which produces cautions.
How do you turn base rates into a probability?
Each section above gives you one input. A worked example shows how they combine. Take a defensive midfielder who starts away from home in La Liga:
| Step | Input (2025/26) | Factor | Estimate |
|---|---|---|---|
| 1. Role | DMs booked in 18.9% of starts | 18.9% | |
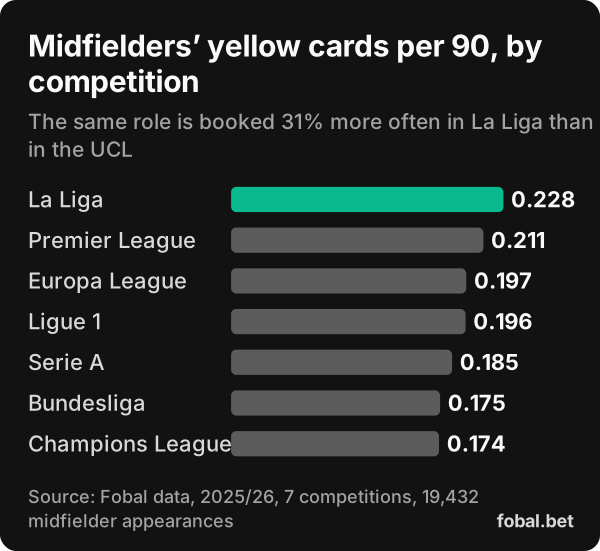
| 2. Competition | La Liga midfielders 0.228 yellows per 90 vs 0.197 overall | × 1.16 | 21.9% |
| 3. Venue | Away 2.16 cards per team vs 2.01 average | × 1.07 | 23.6% |
| 4. Price | 1 ÷ 0.236 | Fair odds ≈ 4.2 (illustrative) |
Source: Fobal data, 2025/26, 7 competitions. DM = defensive midfielder. Factors are rounded; the estimates are computed at full precision.
Now a centre-forward at home in the Champions League. His role starts at 10.8%. Champions League forwards are booked 0.131 times per 90, against 0.156 for all forwards (× 0.84), and home teams average 1.86 cards against 2.01 (× 0.93). The result is about 8%, fair odds near 12. Before you know anything about the players, one card bet is almost three times likelier than the other.
Treat the result as a starting estimate, not a price: the factors overlap a little (a league’s card rate already contains its own home and away matches). Then adjust for what base rates can’t see: the player’s own record, his minutes, his direct opponent and the referee. Blend his season rate with his role’s rate rather than replacing it, because one season is a small sample.
What about the referee?
The referee is the input everyone mentions and few measure well. Fobal’s database doesn’t link referees to matches, so we won’t publish or guess a referee table. What we can say:
- Appointments are known in advance. Leagues usually name officials a few days before kick-off, so the referee is information you can price in before the market does.
- Discretion is built into the Laws. The Laws of the Game say no specific number or pattern of offences defines “persistent offences”. How quickly a referee reaches for the card after the third foul is a style, not a rule.
- Season averages are noisy. A referee’s cards-per-match figure rests on far fewer matches than a league average and depends on which fixtures he was given; a derby-heavy schedule inflates it. Treat him as an adjustment to the base rates, not a replacement. The same sample-size trap applies to players, as our piece on why “8 of the last 10” can mislead explains.
How should you bet cards in-play?
The late clock changes the in-play maths. If your player is still on the pitch and unbooked at half-time, most of the card risk is still ahead of him. More than half of all cards (53%) arrive after the hour.
Three in-play signals are worth more than the pre-match price:
- Game state. A side protecting a narrow lead late commits tactical fouls and wastes time. A side chasing the game commits rash challenges.
- The matchup on the pitch. A full-back being beaten repeatedly by a winger is one foul from a card.
- The substitution board. A player likely to be withdrawn around minute 70 has little time left in the busiest card window.
Prices move fast after flashpoints, so the edge is in reading the build-up, not reacting to the incident.
Player to be booked checklist
- Check the rules first. Does your bookmaker require the player to start? Do reds count? Is it a card market or booking points?
- Confirm he starts. All the rates here are per start. A bench role voids the bet at some bookmakers and kills its value at others.
- Start from the role base rate. Defensive midfielders 18.9%, centre-backs 18.3%, centre-forwards 10.8% of starts.
- Estimate his minutes. A likely 70th-minute substitution removes most of the card window.
- Adjust for the competition. La Liga and the Europa League run hot; the Champions League runs cool.
- Adjust for the venue. Away players are carded more in every competition.
- Read the matchup. Is he up against a player who wins a lot of fouls?
- Factor in the referee, lightly. Use him as a nudge, not the whole case.
- Convert to a probability, then compare. Multiply the base rate by the competition and venue factors (see the worked example), adjust for the player, then compare with the bookmaker’s implied probability (1 ÷ the decimal odds). If your estimate isn’t clearly above it, there is no bet.
If you use Fobal, the player page match log lists fouls committed and yellow cards start by start, and stat leaders rank players on fouls and cards, which is a quick way to test steps 3 and 7.
A note on the data
All figures are 2025/26 averages for seven competitions: the Premier League, La Liga, Serie A, the Bundesliga, Ligue 1, and the Champions League and Europa League from the league phase to the semi-finals. The final round of the Premier League, La Liga and Serie A and both European finals are missing from our database, so we quote averages and rates, not season totals. Yellow cards count the first yellow only; a second-yellow dismissal is counted as a red. Cards to coaches and staff are excluded. This is one season of data, so treat small differences between leagues with caution. Betting should stay fun and affordable: see our guide to responsible betting for player prop bettors.
Frequently asked questions
Does a red card count for a player to be booked bet?
At most bookmakers, yes. Sky Bet’s rules define the market as the player receiving a yellow or red card, so a straight red wins the bet. A second yellow adds nothing extra because the first yellow already settled it. Check your own bookmaker’s rules.
What happens to a player card bet if he comes off the bench?
It depends on the bookmaker. Sky Bet voids the bet only if the player doesn’t play at all. Kambi’s sportsbook terms (version 2.2, September 2026) require the player to start for pre-match disciplinary bets, so a substitute appearance voids the bet at bookmakers that use them.
Do cards shown on the bench or after the final whistle count?
No, at the bookmakers we checked. Only cards shown to players on the pitch during the match count. Cards to managers, to substitutes on the bench and cards shown after full time are excluded.
Which position gets booked the most?
Defensive midfielders. In 2025/26 across the top five leagues, the Champions League and the Europa League, they were booked in 18.9% of their starts, just ahead of centre-backs at 18.3%. Goalkeepers were booked in 5.5% of starts.
Which league has the most yellow cards?
La Liga, with 4.33 yellows and 4.61 total cards per match in 2025/26 (Fobal data). The Champions League was lowest at 3.55 cards per match. Serie A had the most fouls but ranked sixth of seven for cards.
How are booking points calculated?
The usual scale is 10 points for a yellow and 25 for a red, with a maximum of 35 per player, so a player booked and then sent off scores 35, not 45. Kambi’s sportsbook terms set out that scale up to version 2.0 (April 2022). Booking points rules vary by bookmaker, so check yours.