
Player Prop Hit Rates: Why “8 of the Last 10” Misleads
Players who hit 8 of their last 10 hit just 66% of the next 10. Fobal data on 1,055 players shows why player prop hit rates mislead and how to read them.
- #hit-rates
- #sample-size
- #regression-to-the-mean
- #shots-on-target
- #fouls
Answer first: a player prop hit rate over the last 10 matches is mostly a noisy snapshot of the player’s real rate. In Fobal’s 2025/26 data, players who hit 1+ shot on target in 8 of their last 10 starts hit in only 66% of the next 10. Their season-to-date rate predicted those next 10 starts better than the last 10 did.
66.1%
next-10 hit rate after an 8/10 run (1+ shot on target)
Fobal, 2025/26, 7 comps
75.4%
next-10 hit rate after a perfect 10/10 run
11.4 vs 12.2
average miss in points: season-to-date rate vs last-10 rate
1 in 6
chance a genuine 60% player shows 8+ of 10 by luck alone (maths)
“Hit in 8 of the last 10” is the most common line in prop tipping. It is easy to read and feels like evidence. This article tests it against 10,433 player windows from the 2025/26 season and shows what the number is actually worth, why it overstates, and what to use instead.
What does “8 of the last 10” actually tell you?
A hit rate is the share of matches in which a prop line would have won. If a striker had at least one shot on target in 8 of his last 10 starts, his last-10 (L10) hit rate is 80%.
That is a description of the past. Betting needs a forecast: the probability he hits next time. The two are only the same if the last 10 matches perfectly reflect the player’s real level, and 10 matches rarely do. If you are new to the market itself, our guide to shots on target betting covers what counts as a shot on target and what doesn’t.
How much do hot streaks cool off?
We took every player with 20 or more starts across the Premier League, La Liga, Serie A, Bundesliga, Ligue 1, Champions League and Europa League in 2025/26. At each start we recorded his L10 hit rate and what he actually did over the following 10 starts. Then we grouped the windows by L10 record.
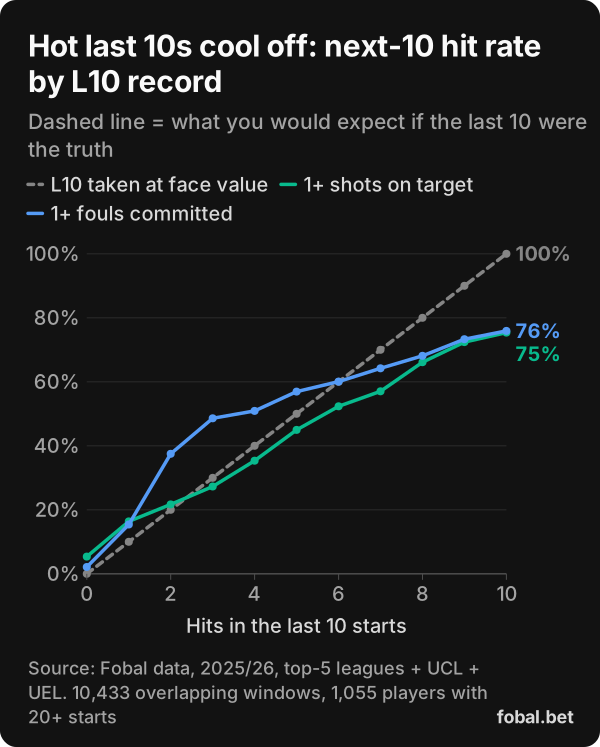
The pattern is the same in both markets:
| Last 10 (1+ SOT) | Next 10, realised | Season rate then | Windows |
|---|---|---|---|
| 10/10 | 75.4% | 89.1% | 41 |
| 9/10 | 72.4% | 82.4% | 116 |
| 8/10 | 66.1% | 73.8% | 296 |
| 7/10 | 57.0% | 65.6% | 421 |
| 6/10 | 52.3% | 57.4% | 609 |
| 0/10 | 5.4% | 1.7% | 2,649 |
For 1+ fouls committed, a 10/10 run became 75.9% over the next 10 and an 8/10 run became 68.1%.
This is regression to the mean. A run of 8, 9 or 10 out of 10 is partly skill and partly luck. The skill carries forward and the luck doesn’t, so the next 10 land closer to the player’s normal level. It works at the bottom too: players on 0/10 still hit 5.4% of the time next.
The size of the effect is measurable. The slope of next-10 hits on L10 hits is 0.74 for shots on target and 0.73 for fouls committed. In plain terms, about a quarter of any L10 edge over the average player washed out in the following 10 starts.
Why is a 10-match sample so noisy?
Even if you knew a player’s true rate exactly, his last 10 would bounce around it. The chart below is not Fobal data. It is the standard binomial calculation for a player who genuinely hits 60% of the time, assuming each match is independent.
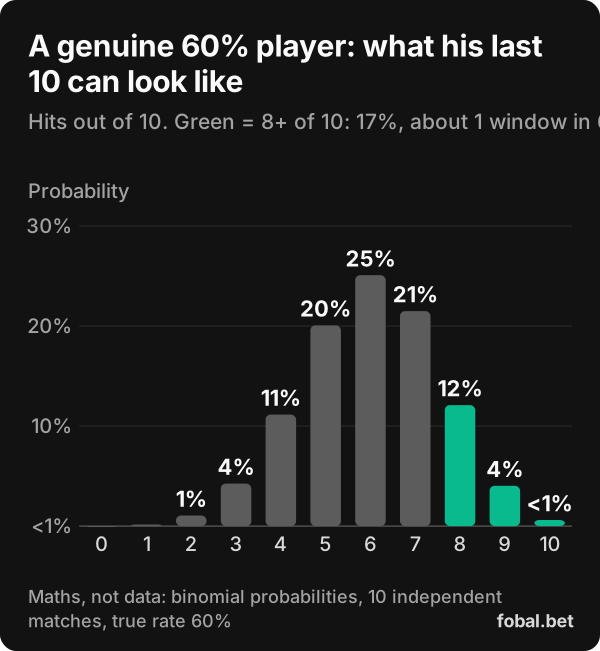
- He shows 8 or more out of 10 about 17% of the time, roughly 1 window in 6.
- He shows 4 or fewer out of 10 about 17% of the time as well.
- Only two windows in three land in the honest 5–7 range.
So a scan of a whole league for “8/10 or better” will pull in genuinely good players and plenty of 60% players who are simply on a good run. That mix is exactly why the 8/10 group delivered 66%, not 80%.
What does a real season look like, start by start?
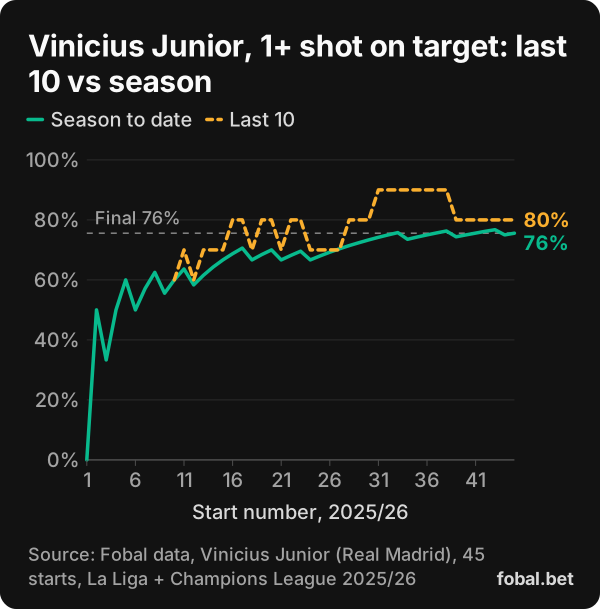
Vinicius Junior’s 2025/26 record for 1+ shot on target, across 45 La Liga and Champions League starts, shows the noise in one player.
Animated strip of Vinicius Junior's 45 starts in 2025/26, each marked hit or miss for 1+ shot on target. A running hit-rate line starts at 0% after one start, jumps to 50%, dips to 33% after three, reaches 60% after ten and gradually settles at 76% (34 of 45). A last-10 line wobbles between 60% and 90%.
After one start his hit rate was 0%. After three it was 33%, and after ten it was 60%. It finished at 75.6% (34 of 45). His L10 ranged from 60% to 90%. From early March to early April he was 9/10 in his last 10, a run that looked like a near-certainty, while his true rate across the season was nearer 75%.
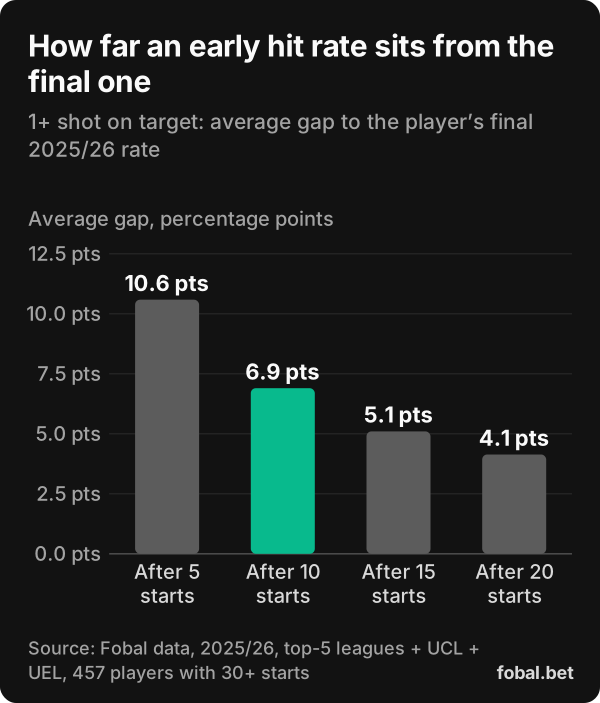
Across all 457 players with 30+ starts, the hit rate after 5 starts was on average 10.6 points away from the player’s final season rate. After 10 starts the gap was 6.9 points, and after 20 starts it was still 4.1 points. Fouls committed converged more slowly: 14.4, 8.8 and 4.8 points.
Should you use the last 10 or the season rate?
We tested five predictors of the next-10 hit rate on the same 10,433 windows: the season-to-date rate alone, the L10 alone, and three blends of the two.
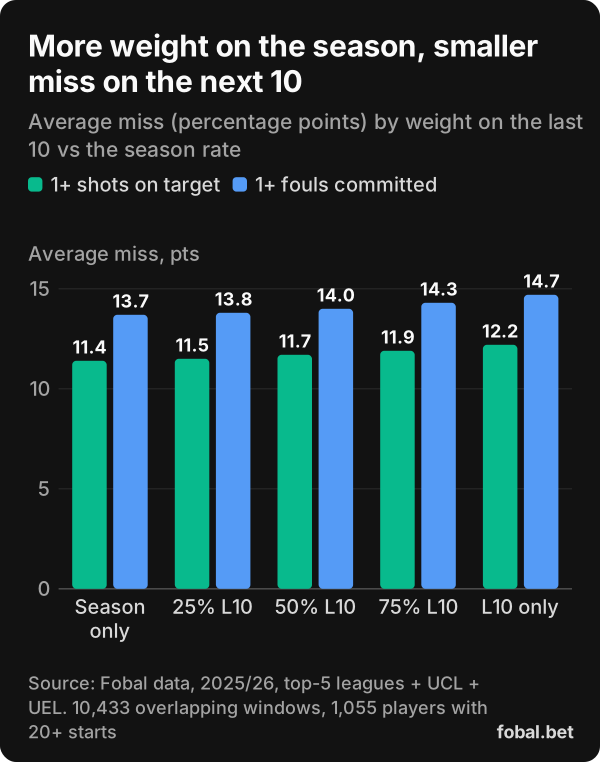
| Predictor of the next 10 starts | Average miss, 1+ SOT | Average miss, 1+ fouls committed |
|---|---|---|
| Season-to-date rate | 11.4 pts | 13.7 pts |
| 50/50 blend of season and L10 | 11.7 pts | 14.0 pts |
| Last-10 rate | 12.2 pts | 14.7 pts |
| One average for every player | 19.6 pts | 21.9 pts |
The season rate won in both markets, and at every blend weight. It held even early: with only 10–14 starts behind the player, the season rate missed by 12.4 points against 12.6 for the L10. With 20–29 starts behind, the gap was 10.6 against 12.1.
Remember that the season-to-date rate already contains the last 10. Leaning on the L10 counts those matches twice. Both beat a single league-wide average by a wide margin, so player history matters. It just needs more than 10 matches.
The table above also shows a subtler point. For players on 8/10, even the season-to-date rate (73.8%) overshot the next 10 (66.1%), because the hot run had inflated it. When a player is selected for a hot streak, shade even the season rate down a little.
When does the last 10 deserve more weight?
The season rate assumes the player is the same player all season. Sometimes he isn’t:
- Role change. A winger moved to centre forward, or a midfielder pushed higher, changes shot volume.
- Minutes change. A player who went from 60-minute starts to full matches has more time to hit. Our guide to expected minutes in player props shows how much minutes drive the numbers.
- New club or new manager. Old data describes a different system.
- Return from injury. The first few matches back are often managed.
In these cases, don’t just trust the L10 instead. Start a new sample from the change, and treat it as small: 5 or 10 matches since a change is still a 5- or 10-match sample. Also check whether the L10 itself mixes starts and cameos. Our data used starts only, and a hit rate built on 20-minute substitute appearances is a different number entirely.
How does a hit rate compare with the odds?
A bookmaker’s price converts to an implied probability: 1 divided by the decimal odds. The comparison only makes sense against your estimate of the true rate.
Illustrative example (not a real price): a forward is 8/10 for 1+ shot on target and is offered at 1.50. The implied probability is 66.7%. Against the raw 80%, that looks like a 13-point edge. Against what 8/10 shooters actually delivered next (66.1%), there is no edge at all. And the price already contains the bookmaker’s margin.
| What you see | What to use instead |
|---|---|
| 8/10 in the last 10 (looks like 80%) | About 66%: the season rate, shaded towards the average |
| 10/10 (looks like “can’t miss”) | About 75%: the best group, but one miss in four |
| 0/10 or 1/10 (looks like “never hits”) | 5–16%: rarely zero |
| Hot run after a role change (looks like a new level) | A new, small sample: weight it carefully |
In the Fobal app, each pick shows its last-5 and last-10 hit rates, and each player’s form chart marks substitute appearances game by game, so you can see what is behind a streak before you trust it. For how the hit rates themselves are built, see how Fobal calculates hit rates.
Checklist: before you trust a hit rate
- Check the sample size. Under 15–20 matches, treat any hit rate as a rough range, not a number.
- Compare with the season rate. If the L10 is far above it, expect the next 10 to land nearer the season figure.
- Shade hot streaks down. For 8/10 shooters, 66% was the realistic next-10 figure in 2025/26.
- Look for a real change. Role, minutes, club, manager or injury. If nothing changed, the streak is probably mostly noise.
- Strip out cameos. Check that the record is built on starts if you are betting on a starter.
- Convert the odds. Implied probability = 1 ÷ decimal odds. Compare it with your adjusted estimate, not the raw L10.
- Check the rules. Know how your bookmaker settles non-starters and substitutes before you bet. Our guide to how player props are settled explains the common rules.
How we measured this
Data: Fobal’s 2025/26 database covering the Premier League, La Liga, Serie A, Bundesliga, Ligue 1, and the Champions League and Europa League main draws. We used starts only (minutes above zero) and players with 20+ starts: 1,055 players. A window is a start with at least 10 starts before and 10 after. The windows overlap (one player contributes many), so the 10,433 windows are not independent samples; treat the averages as descriptive, not as a controlled experiment. Convergence uses the 457 players with 30+ starts. The binomial chart is a calculation, not data. Markets: 1+ shots on target and 1+ fouls committed, as recorded by Fobal’s data provider. Some final-round fixtures are missing from the database, which does not change these rates materially.
For the wider picture of the markets these numbers apply to, start with our complete guide to football player props.
Frequently asked questions
What is a player prop hit rate?
A hit rate is the share of a player’s matches in which a prop line would have won, for example 1+ shot on target in 7 of his last 10 starts is a 70% hit rate. It describes the past; it is not a probability for the next match.
Is a last 10 games hit rate a good predictor?
It is a weak one on its own. In Fobal’s 2025/26 data, players who hit 1+ shot on target in 8 of their last 10 starts hit in 66.1% of the next 10, and the season-to-date rate predicted the next 10 starts more accurately than the last 10.
What is regression to the mean in betting?
It is the tendency of an extreme short-run record to drift back towards the player’s normal level. A 9/10 or 10/10 run usually contains some luck, and luck does not repeat, so the next 10 matches tend to land closer to the season average.
How many matches do you need for a reliable hit rate?
More than 10. In Fobal’s data, after 10 starts a player’s 1+ shot on target hit rate was on average 6.9 points away from his final season rate, and after 20 starts it was still 4.1 points away.
How do I compare a hit rate with the odds?
Convert the decimal odds to an implied probability (1 divided by the odds), then compare it with your estimate of the player’s true rate, not his raw last-10 rate. At illustrative odds of 1.50 the implied probability is 66.7%, which is roughly what an 8/10 shooter actually delivered next.