
Best League for Player Props: Cards, Shots, Fouls Compared
Which European league is best for player props? 2,097 matches of 2025/26 data compare cards, fouls, shots, SOT%, tackles and saves in seven competitions.
- #leagues
- #cards
- #fouls
- #shots-on-target
- #tackles
- #saves
- #data
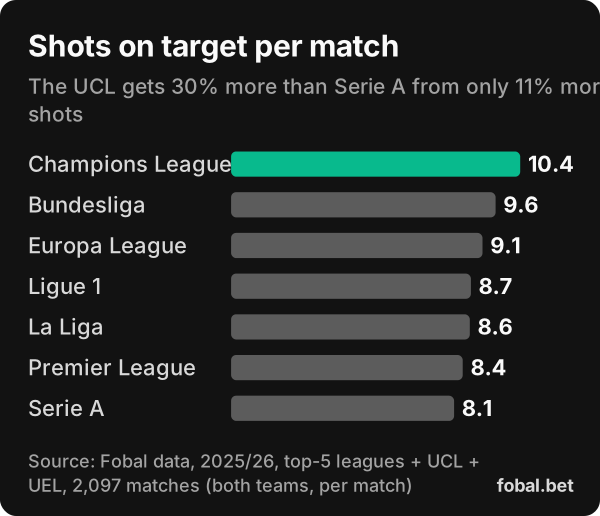
There is no single best league for player props: each market has its own winner. On 2025/26 data, La Liga is best for cards (4.61 per match), Serie A for fouls (25.4), the Champions League for shots, shots on target and goalkeeper saves, and the Europa League for tackles won. Serie A sits bottom for shots, accuracy and tackles.
4.61
cards per match in La Liga, the most of seven competitions
Fobal, 2025/26, 2,097 matches
25.4
fouls per match in Serie A, but only 0.144 yellows per foul
38.2%
of Champions League shots on target, the highest accuracy
7.0
goalkeeper saves per Champions League match (Premier League 5.5)
This comparison uses every analysed match of 2025/26 in the Premier League, La Liga, Serie A, the Bundesliga, Ligue 1, the Champions League and the Europa League: 2,097 matches. All figures are per-match averages for both teams combined. The method and its limits are at the end.
Each league’s props fingerprint
The chart below compresses the whole comparison. Each dot shows how far a competition sits above or below the seven-competition average for one market, and the labels give each row’s highest and lowest market.
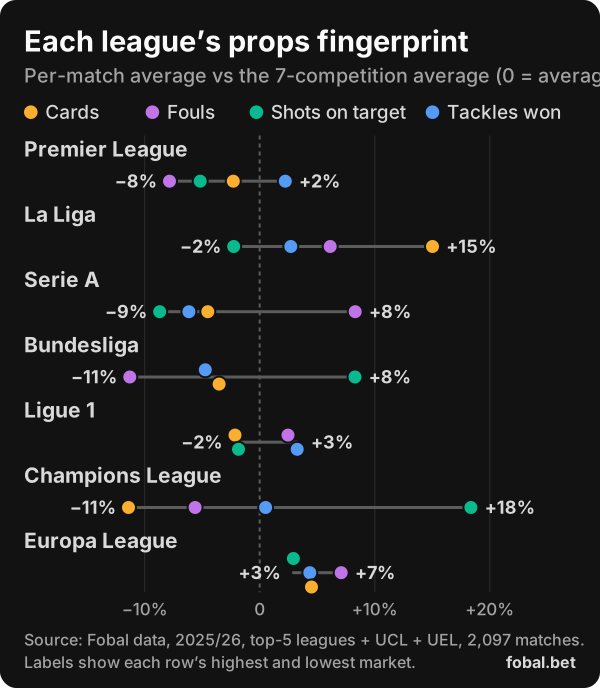
Three patterns jump out:
- Discipline and shooting pull in opposite directions. The Champions League and the Bundesliga sit high on shots on target and low on fouls. Serie A is the reverse.
- Fouls are not cards. Serie A is the most foul-heavy competition but below average for cards. La Liga is high on both.
- The Premier League is the quiet one. It is below average on cards, fouls and shots on target. Its distinguishing features are elsewhere: the fewest red cards and the most corners.
Best league for player props, market by market
| Market (per match) | Highest | Lowest | 7-competition average |
|---|---|---|---|
| Cards (yellow + red) | La Liga (4.61) | Champions League (3.55) | 4.01 |
| Fouls | Serie A (25.4) | Bundesliga (20.8) | 23.5 |
| Yellow cards per foul | Bundesliga (0.178) | Serie A (0.144) | 0.162 |
| Shots | Champions League (27.3) | Serie A (24.6) | 25.3 |
| Shots on target | Champions League (10.4) | Serie A (8.1) | 8.8 |
| Share of shots on target | Champions League (38.2%) | Serie A (32.7%) | 34.8% |
| Tackles won | Europa League (20.2) | Serie A (18.2) | 19.4 |
| Goalkeeper saves | Champions League (7.0) | Premier League (5.5) | 6.0 |
| Goals | Champions League (3.47) | Serie A (2.42) | 2.82 |
Source: Fobal data, 2025/26, top-5 leagues + UCL + UEL, 2,097 matches. Both teams combined.
The rest of this guide goes market by market, then profiles each competition.
Which league is best for card bets?
La Liga, by a distance.
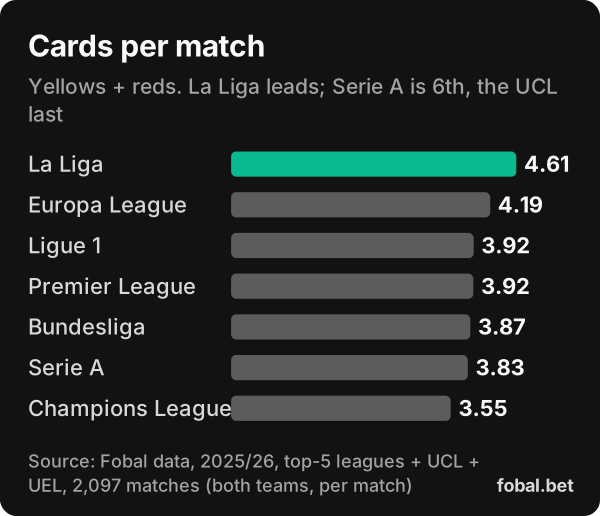
La Liga averages 4.33 yellows and 0.28 reds per match, the most of the seven on both counts. A player is sent off in 23.0% of La Liga matches, and 91.4% of La Liga teams receive at least one card in a match. Its midfielders are booked 0.228 times per 90 and its defenders 0.218, the highest rates for those groups anywhere in our data.
The other end of the table is just as useful. The Champions League averages 3.55 cards (3.36 yellows), the fewest. The Premier League sits mid-table on cards at 3.92 but has the fewest reds: 0.12 per match, a red in 10.5% of matches. Red-card markets in England start from a low base.
Spread matters as much as the mean. In La Liga, the quietest tenth of matches had two cards or fewer and the busiest tenth eight or more. In most other competitions that range runs from one to six or seven. Card totals in Spain are higher and less predictable. For the player-level view (which roles get booked, and when) see our guide to player to be booked bets.
Why does Serie A have the most fouls but so few cards?
Because Italian referees book fewer players per foul than anyone else.
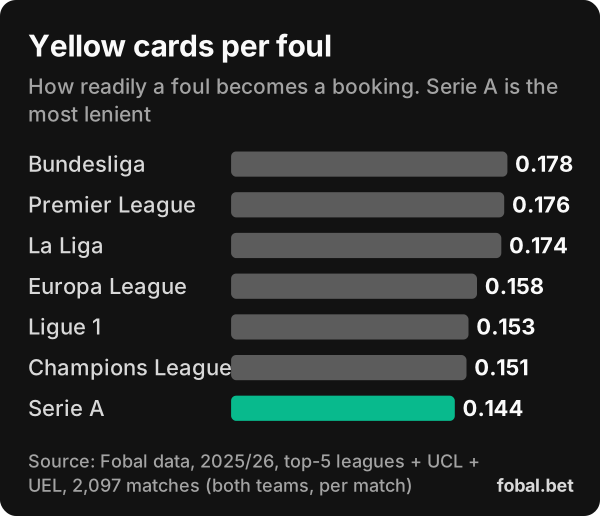
Serie A records 25.4 fouls per match, the most of the seven, but only 0.144 yellows per foul, the fewest. That leaves it on 3.66 yellows per match, sixth of seven. The Bundesliga is the mirror image: the fewest fouls (20.8) but the highest conversion (0.178 yellows per foul). The Premier League is similar (0.176).
This is the single most useful idea in the comparison. A league’s foul count tells you about fouls markets; its conversion rate tells you about card markets. Serie A’s reputation for cards rests on fouls, and the 2025/26 data don’t support it. If a bookmaker prices Serie A card markets on reputation, that is where to look for a mismatch.
Which league is best for fouls props?
Serie A, then the Europa League and La Liga.
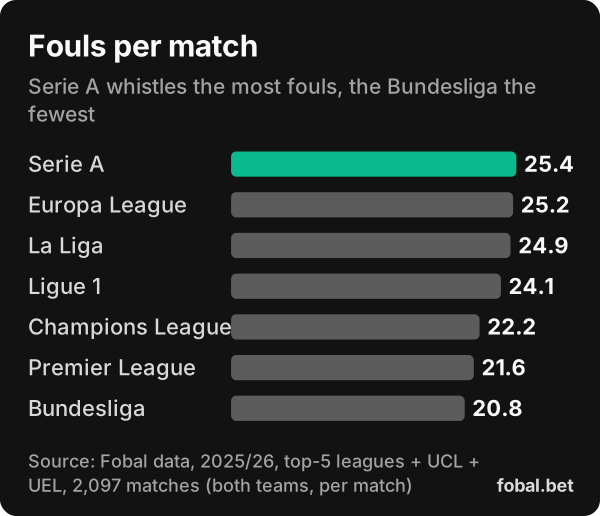
Serie A has about 22% more fouls per match than the Bundesliga: 25.4 against 20.8. Per team, that is 12.7 against 10.4. A winger who wins 2.5 fouls per 90 in a Bundesliga side would, on league effect alone, be expected to win more in Italy. Seven of the 15 players with the highest fouls-won rate in our data play in Serie A.
The Premier League (21.6) and the Bundesliga (20.8) are the two low-foul leagues. Our fouls committed and fouls won guide shows how to read the individual matchup on top of this baseline.
Which league is best for shots and shots on target?
The Champions League, then the Bundesliga.
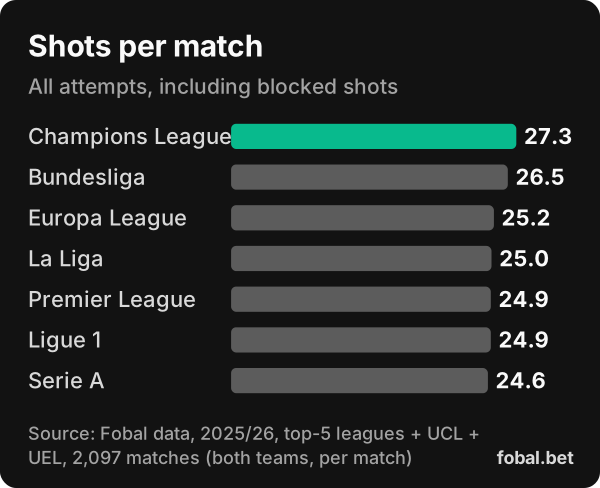
Shot volume is flatter than you might expect. Five of the seven competitions sit between 24.6 and 25.2 shots per match. Only the Champions League (27.3) and the Bundesliga (26.5) stand clear.
Accuracy is where leagues separate:
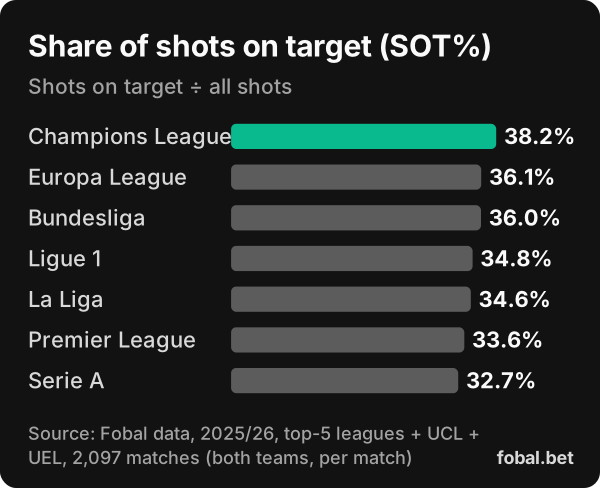
Combine volume and accuracy and you get shots on target per match: Champions League 10.4, Bundesliga 9.6, Europa League 9.1, Ligue 1 8.7, La Liga 8.6, Premier League 8.4, Serie A 8.1. A Champions League match produces about 30% more shots on target than a Serie A match, from only 11% more shots.
For shots on target props, that accuracy gap matters more than shot counts. Serie A is lowest on shots, shots on target and accuracy at once, which makes it the toughest league for overs on attacking players. The shots vs shots on target guide explains what counts as on target, including why most blocked shots are not.
Which league is best for tackles props?
The Europa League and Ligue 1. “Tackles” here means tackles won: the tackler or a team-mate regains possession. Total tackle attempts run much higher, so check which statistic your bookmaker settles on before comparing lines.
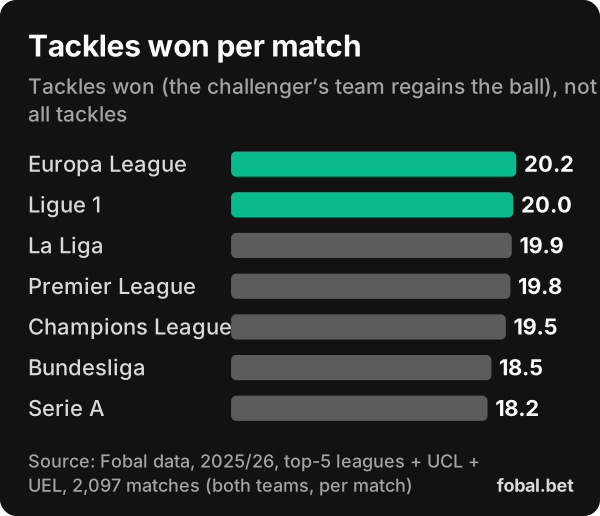
The range is narrow: 18.2 in Serie A to 20.2 in the Europa League, and five competitions sit within 0.8 of each other. League choice matters less for tackles than for cards or shots on target, and a player’s role and his team’s share of the ball matter more. Serie A is lowest again, with the Bundesliga (18.5) just above it.
Which league is best for goalkeeper saves?
The Champions League. Both goalkeepers combined make 7.0 saves per Champions League match, then 6.3 in the Europa League and 6.2 in the Bundesliga. The Premier League has the fewest at 5.5, just under Serie A (5.6).
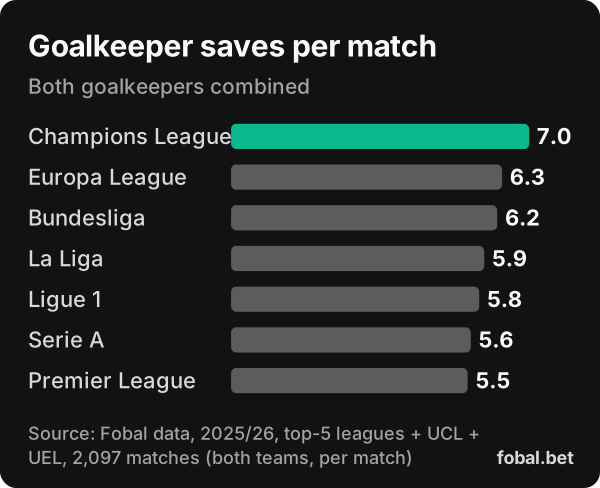
Saves follow shots on target, so the order looks familiar. The Premier League is the outlier: it has more shots on target than Serie A (8.4 against 8.1) but fewer saves (5.5 against 5.6). A save needs an on-target shot that doesn’t go in, and more Premier League shots ended up as goals (2.76 per match against 2.42).
Goals follow the same shape: the Champions League averages 3.47 per match and the Bundesliga 3.24, against 2.42 in Serie A.
How do European nights compare with domestic leagues?
The two UEFA competitions behave very differently from each other, and a player’s numbers can shift when he switches between them and his league in the same week.
- Champions League matches are open and clean. More shots (27.3), better accuracy (38.2%) and more saves (7.0) than any domestic league, with the fewest cards (3.55). A domestic card specialist can look very different on a Champions League night.
- Europa League matches are physical. The second-most cards (4.19) and fouls (25.2) and the most tackles won (20.2). For discipline and defensive markets, it plays more like La Liga than like the Champions League.
- Rotation is the hidden variable. In our data, clubs made 3.43 changes to their league starting XI after a European match within the previous four days, against 2.96 otherwise (an illustrative figure, 72 clubs). Before backing a regular, check that he is likely to start both games; our guide to expected minutes covers this.
Card counts also depend on venue in every competition: away teams were carded more than home teams in all seven, with the widest gap in the Premier League (1.76 home, 2.16 away per team).
Do league averages hide big swings?
Yes. The difference between leagues is smaller than the difference between matches in the same league.
| Per match | Lowest 10% of matches | Median | Highest 10% of matches |
|---|---|---|---|
| Cards, La Liga | 2 | 4 | 8 |
| Cards, Champions League | 1 | 3 | 6 |
| Fouls, Serie A | 18 | 25 | 33 |
| Fouls, Bundesliga | 14 | 21 | 27 |
| Shots on target, Champions League | 6 | 10 | 15 |
| Shots on target, Premier League | 5 | 8 | 12 |
Source: Fobal data, 2025/26 (10th percentile, median and 90th percentile per match).
La Liga’s average is about one card higher than the Champions League’s, but within La Liga alone a match at the 90th percentile has four times as many cards (8) as one at the 10th percentile (2). Match context (derbies, relegation fights, a team chasing a result) moves the numbers more than the league does. Use the league as the starting point, then adjust.
League profiles
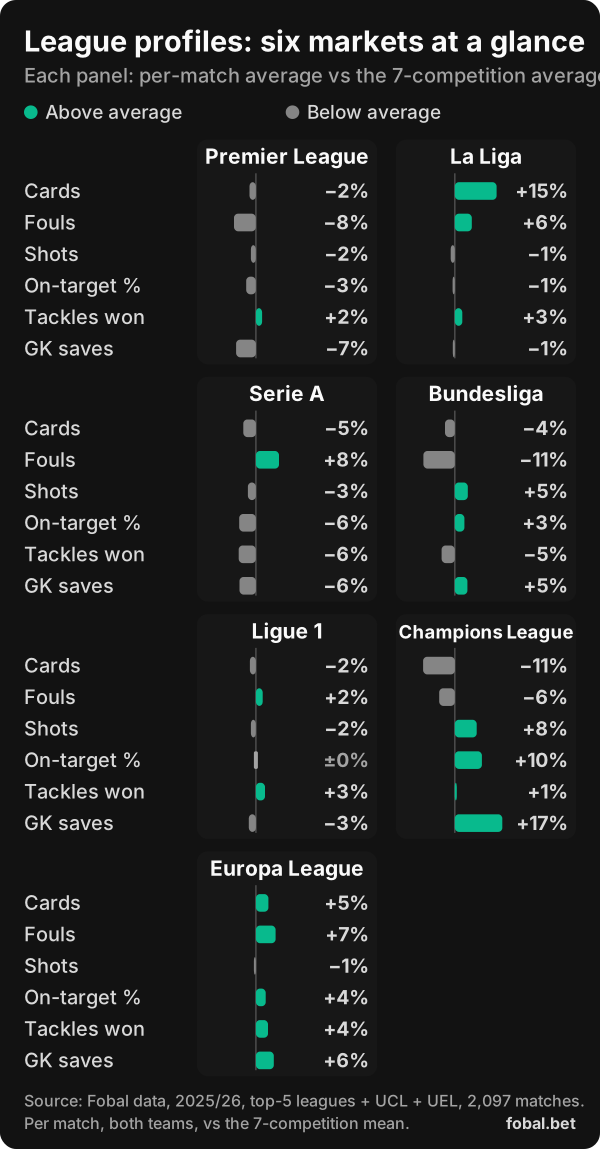
Each panel shows one competition across six markets, measured against the seven-competition average. Green bars sit above average, grey below.
Premier League
The fewest reds (a red in 10.5% of matches), few fouls (21.6) and the fewest saves (5.5), but fouls turn into yellows readily and its midfielders are booked 0.211 times per 90, second only to La Liga. The most corners (9.95). Props angle: midfielder cards over defender cards; little reason to chase reds.
La Liga
The card league: the most cards, yellows and reds per match, plus the most offsides (3.82). Shooting is average and goals are low. Props angle: the natural home for player to be booked bets, on midfielders and defenders.
Serie A
The most fouls and the fewest yellows per foul; last of the seven for shots, shots on target, accuracy, tackles won and goals. Props angle: fouls committed and fouls won; be wary of shots on target overs and of card bets priced on reputation.
Bundesliga
The fewest fouls but the highest booking rate per foul; second only to the Champions League for shots, shots on target and goals. Props angle: the best domestic league for shots on target and saves, the weakest for fouls.
Ligue 1
Close to average almost everywhere, except the second-highest red-card rate (a red in 22.3% of matches) and the second-most tackles won. Props angle: tackles won and reds; no shooting edge.
Champions League
The attacking competition (first for shots, shots on target, accuracy, saves and goals) and the calmest (fewest cards). Props angle: shots on target and saves; the weakest for card bets. Only 188 matches, a smaller sample.
Europa League
Second for cards and fouls, first for tackles won. Props angle: defensive and discipline markets. Also a 188-match sample, so treat narrow gaps with care.
The full ranking tables
Discipline
| Competition | Cards | Yellows | Reds | Fouls | Yellows per foul |
|---|---|---|---|---|---|
| Premier League | 3.92 | 3.80 | 0.12 | 21.6 | 0.176 |
| La Liga | 4.61 | 4.33 | 0.28 | 24.9 | 0.174 |
| Serie A | 3.83 | 3.66 | 0.17 | 25.4 | 0.144 |
| Bundesliga | 3.87 | 3.70 | 0.17 | 20.8 | 0.178 |
| Ligue 1 | 3.92 | 3.68 | 0.25 | 24.1 | 0.153 |
| Champions League | 3.55 | 3.36 | 0.20 | 22.2 | 0.151 |
| Europa League | 4.19 | 3.98 | 0.21 | 25.2 | 0.158 |
Shots, tackles and saves
| Competition | Shots | On target | On target % | Tackles won | Saves | Goals |
|---|---|---|---|---|---|---|
| Premier League | 24.9 | 8.4 | 33.6% | 19.8 | 5.5 | 2.76 |
| La Liga | 25.0 | 8.6 | 34.6% | 19.9 | 5.9 | 2.68 |
| Serie A | 24.6 | 8.1 | 32.7% | 18.2 | 5.6 | 2.42 |
| Bundesliga | 26.5 | 9.6 | 36.0% | 18.5 | 6.2 | 3.24 |
| Ligue 1 | 24.9 | 8.7 | 34.8% | 20.0 | 5.8 | 2.83 |
| Champions League | 27.3 | 10.4 | 38.2% | 19.5 | 7.0 | 3.47 |
| Europa League | 25.2 | 9.1 | 36.1% | 20.2 | 6.3 | 2.71 |
Source for both tables: Fobal data, 2025/26, per match, both teams, 2,097 matches (Premier League, La Liga and Serie A 370 each; Bundesliga 306; Ligue 1 305; Champions League and Europa League 188 each).
How should you use league data in a bet?
Bookmakers know these averages too, so a high league average is not an edge by itself. League data earns its keep in six ways:
- Set the baseline before the player. Start every line from the competition’s average for that market, then adjust for the player’s role, minutes and opponent.
- Look for reputation gaps. Where the data disagree with the stereotype (Serie A cards, Premier League red cards), prices built on reputation can be off.
- Re-base players after a transfer. A defender moving from Serie A (0.189 yellows per 90 for defenders) to La Liga (0.218) should be booked more often, before anything about him changes. The same applies to a winger moving into a high-foul league.
- Separate fouls from cards. Use foul counts for fouls markets and yellows per foul for card markets. They rank the leagues differently.
- Respect the spread. A single match can sit far from its league’s average. Size your stakes for variance, and remember that one good run of results is a small sample.
- Mind the minutes and the rules. League effects only apply while the player is on the pitch, and settlement rules decide what counts. See expected minutes and how player props are settled.
Fobal tracks player statistics across all seven competitions, so you can set a player’s numbers against his league’s baseline before you look at a line. New to these markets? Start with our complete guide to football player props.
Method and caveats
- Window. The 2025/26 season only. Our database has no 2024/25 data for these competitions, so this comparison can’t yet check whether the rankings hold from one season to the next. Treat narrow gaps (for example in tackles won) as provisional.
- Coverage. 2,097 matches. The final round of the Premier League, La Liga and Serie A (10 matches each) and the Champions League and Europa League finals are missing, and one abandoned Ligue 1 match is excluded. That is why we quote per-match averages, not season totals.
- European competitions. Champions League and Europa League figures cover the league phase to the semi-finals; qualifying rounds are excluded. Each has 188 matches, a smaller sample than the domestic leagues.
- Definitions. Per-match figures combine both teams. Shots include blocked shots. Tackles are tackles won. Yellow cards count first yellows; a second-yellow dismissal counts as one yellow and one red. Cards to coaches and staff are excluded. Goals include own goals.
- Sources. Goals, shots, shots on target, fouls and saves come from team match statistics; cards and tackles won are summed from player statistics. The two sources agree within about 1%.
Betting on any league should stay within limits you set in advance. Our guide to responsible betting for player prop bettors lists help resources.
Frequently asked questions
Which league has the most cards per match?
La Liga. In 2025/26 it averaged 4.61 cards per match (4.33 yellows and 0.28 reds), ahead of the Europa League at 4.19. The Champions League was lowest at 3.55. Source: Fobal data, 2,097 matches across seven competitions.
Is Serie A the best league for card bets?
Not on 2025/26 data. Serie A had the most fouls of the seven competitions (25.4 per match) but ranked sixth for cards (3.83), because its referees booked the fewest players per foul (0.144 yellows per foul).
Which league has the most shots on target?
The Champions League, with 10.4 shots on target per match and 38.2% of shots on target. Among domestic leagues the Bundesliga leads with 9.6 shots on target and 26.5 shots per match. Serie A is lowest at 8.1.
Which league is best for fouls props?
Serie A, with 25.4 fouls per match, followed by the Europa League (25.2) and La Liga (24.9). The Bundesliga has the fewest at 20.8, about 18% fewer fouls per match than Serie A.
Which league is best for goalkeeper saves props?
The Champions League, at 7.0 saves per match for both goalkeepers combined, then the Europa League (6.3) and the Bundesliga (6.2). The Premier League has the fewest at 5.5.
Should I bet on a league just because its average is high?
No. Bookmakers know league averages and price them in. League data is most useful as a baseline for a player’s own numbers, for spotting where a reputation disagrees with the data, and for adjusting a player’s rates after a transfer.