
Fouls Committed and Fouls Won: Betting the Matchup
Fouls committed betting starts with the matchup. Data on 2,097 matches: which roles foul and get fouled, the top players per 90 and how settlement works.
- #fouls
- #fouls-won
- #fouls-committed
- #matchups
- #serie-a
Fouls committed betting is matchup betting. Pair a player who wins fouls with an opponent who gives them away. In 2025/26 wingers won the most fouls per 90 (up to 1.58), centre-forwards committed the most (1.46), and the league set the baseline: Serie A 25.4 fouls per match, the Bundesliga 20.8.
1.58
fouls won per 90 by left wingers, the highest of any role
Fobal, 2025/26, 7 competitions
1.46
fouls committed per 90 by centre-forwards, the highest of any role
2.47
opponent yellow cards when a team wins 14+ fouls (1.23 at 0–7)
25.4
fouls per match in Serie A, the most of the seven competitions
The numbers come from Fobal’s 2025/26 data for the Premier League, La Liga, Serie A, the Bundesliga, Ligue 1, the Champions League and the Europa League: 2,097 matches and 65,038 player appearances.
What counts as a foul committed and a foul won?
Bookmakers settle these markets on data-provider statistics, usually Opta. The Opta definitions published by Sky Bet set the rules:
- Foul committed: any infringement the referee penalises as foul play with a free kick or penalty. Offsides are not fouls.
- Advantage: if the referee plays advantage, no foul is credited, even if a card follows when the ball goes out.
- Foul won: credited to the player who wins a free kick or penalty after being fouled. There is no foul won for a handball, a dive, a back pass, an illegal restart, dissent, a goalkeeper six-second violation or obstruction.
The advantage rule matters for fouls won. A winger who is clipped but keeps running, or whose team keeps the ball, gets nothing. Fast, direct dribblers on attacking teams lose some fouls this way.
Participation rules vary too. Kambi’s sportsbook terms (v2.2, last updated September 2026), section C13 rule 6, say pre-match disciplinary bets on an individual, including number of fouls, need the player to start. Other bookmakers void only if the player doesn’t play at all. Check your own bookmaker’s rules; our guide to how player props are settled covers voids in depth.
How does the winger vs full-back matchup work?
A stylised winger dribbles at a full-back three times and is fouled each time. With every foul the winger's fouls won counter and the full-back's fouls committed counter tick up together, reaching three each, and the third foul brings a yellow card for the full-back.
Every foul feeds two markets at once. When a winger is tripped, his fouls won line and the defender’s fouls committed line both move. That gives you a way to price a duel instead of a player:
- Find the foul-winner. Wingers and attacking midfielders who carry the ball into tight spaces.
- Find who has to stop him. Usually the opposite full-back, often helped by a winger or a defensive midfielder.
- Check both players’ rates. A high foul-winner against a defender who rarely fouls is a fouls won bet. A high foul-winner against a defender who fouls a lot is a candidate on both sides, and possibly a player to be booked bet on the defender.
Remember which side of the pitch: a left winger mostly faces the right-back, and vice versa.
Which positions win and commit the most fouls?
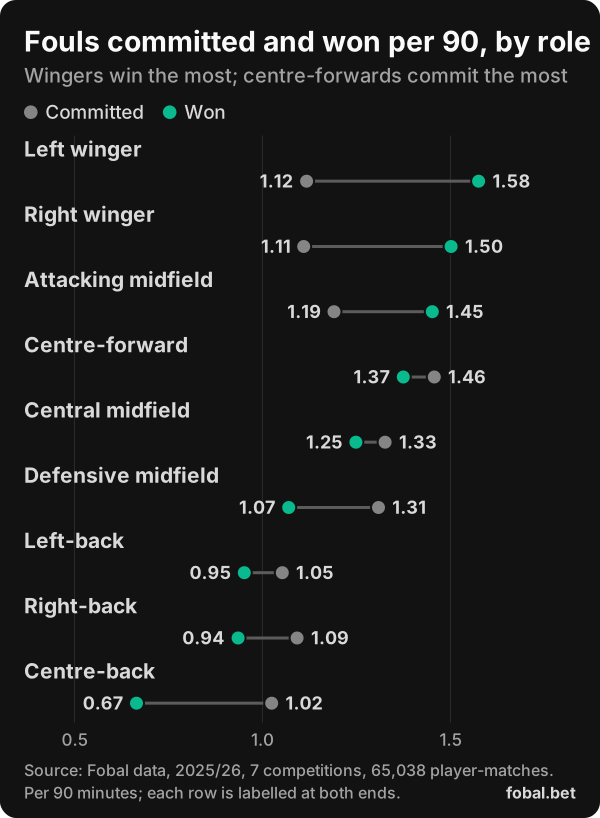
| Role | Committed per 90 | Starts with 1+ committed | Won per 90 | Starts with 1+ won |
|---|---|---|---|---|
| Left winger | 1.12 | 55% | 1.58 | 67% |
| Right winger | 1.11 | 56% | 1.50 | 66% |
| Attacking midfield | 1.19 | 60% | 1.45 | 66% |
| Centre-forward | 1.46 | 65% | 1.37 | 64% |
| Central midfield | 1.33 | 66% | 1.25 | 62% |
| Defensive midfield | 1.31 | 68% | 1.07 | 57% |
| Left-back | 1.05 | 59% | 0.95 | 55% |
| Right-back | 1.09 | 60% | 0.94 | 54% |
| Centre-back | 1.02 | 60% | 0.67 | 44% |
Source: Fobal data, 2025/26, 7 competitions. “Starts with 1+” is the share of starts in which the player recorded at least one, the outcome of a 0.5 line.
Three things stand out:
- Wingers win the most. As a group, forwards win 1.46 fouls per 90 and commit 1.28. Midfielders are nearly balanced (1.29 committed, 1.23 won). Defenders commit 1.04 and win 0.79.
- Centre-forwards foul more than anyone. At 1.46 per 90 they commit more fouls than defensive midfielders (1.31). Holding the ball up with your back to goal means constant contact with centre-backs, and referees penalise the attacker in many of those duels.
- Full-backs are not natural foulers. Right-backs commit 1.09 per 90 and left-backs 1.05, below every midfield role. An “aggressive full-back” is a player-level trait, not a positional one, so check the individual.
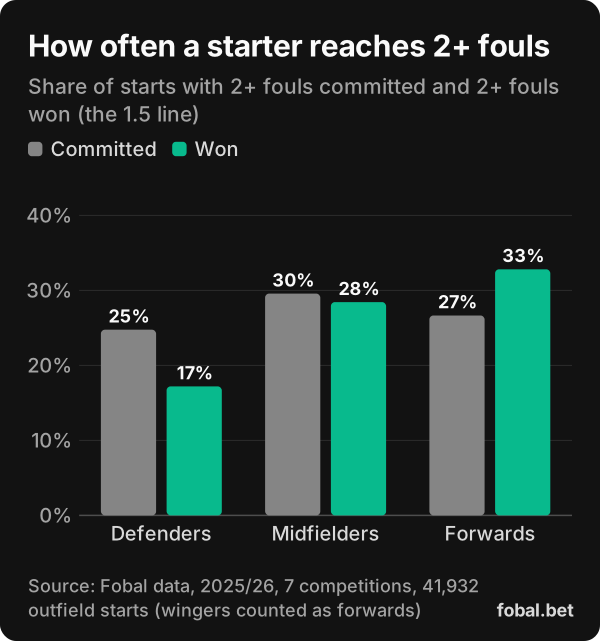
For context, the median player with 900+ minutes commits 1.08 fouls and wins 0.93 per 90. Starters commit at least one foul in 56.1% of their starts and win at least one in 53.1%. Two or more is far rarer: 24.3% of starts for fouls committed and 22.8% for fouls won, so an over 1.5 line needs a clearly above-average player.
Who commits and wins the most fouls?
These lists use players with 1,800+ minutes (1,000 players). Lower thresholds fill up with impact substitutes whose per-90 rates are inflated by short cameos.
Top foul committers per 90
| Player | Club | Minutes | Fouls committed per 90 |
|---|---|---|---|
| Mario Martín Rielves | Getafe | 2,047 | 2.99 |
| Tim Lemperle | TSG Hoffenheim | 1,961 | 2.75 |
| Dayann Methalie | Toulouse | 1,883 | 2.72 |
| Igor Matanovic | SC Freiburg | 2,283 | 2.68 |
| Pol Lozano | Espanyol | 2,171 | 2.65 |
| Lucas Boyé | Deportivo Alavés | 1,874 | 2.64 |
| Mateo Pellegrino | Parma | 2,904 | 2.57 |
| Nicolò Zaniolo | Udinese | 2,272 | 2.46 |
| Cesare Casadei | Torino | 1,943 | 2.36 |
| Santiago Pierotti | Lecce | 2,549 | 2.33 |
| Nikola Krstović | Atalanta | 2,362 | 2.32 |
| Breel Embolo | Rennes | 1,881 | 2.30 |
| Danny Namaso | Auxerre | 2,528 | 2.28 |
| Joelinton | Newcastle United | 2,548 | 2.26 |
| Jon Aramburu | Real Sociedad | 2,701 | 2.23 |
Top foul winners per 90
| Player | Club | Minutes | Fouls won per 90 |
|---|---|---|---|
| Nicolò Cambiaghi | Bologna | 1,998 | 4.37 |
| Mattia Zaccagni | Lazio | 2,114 | 3.49 |
| Johan Manzambi | SC Freiburg | 3,116 | 3.32 |
| Aleix Febas | Elche | 3,082 | 3.18 |
| Marco Palestra | Cagliari | 3,058 | 3.18 |
| Iván Romero | Levante | 2,202 | 3.07 |
| Jérémy Doku | Manchester City | 2,402 | 3.03 |
| Pio Esposito | Inter | 1,989 | 2.99 |
| Nicola Zalewski | Atalanta | 2,258 | 2.91 |
| Afonso Moreira | Olympique Lyonnais | 2,076 | 2.90 |
| Antonio Nusa | RB Leipzig | 2,042 | 2.82 |
| Federico Bonazzoli | Cremonese | 2,440 | 2.80 |
| Breel Embolo | Rennes | 1,881 | 2.78 |
| Vitinha | Genoa | 2,242 | 2.73 |
| Aimar Oroz | Osasuna | 2,072 | 2.69 |
Source for both tables: Fobal data, 2025/26, 7 competitions, players with 1,800+ minutes. Club = the club where he played most minutes.
Look at who fouls: six of the 15 (Lemperle, Matanovic, Boyé, Pellegrino, Krstović and Embolo) are centre-forwards. The committers list is as much about target men as about midfield destroyers. Breel Embolo appears on both lists (2.30 committed, 2.78 won), the profile of a striker in a physical duel all match. Seven of the 15 top foul winners play in Serie A, the league that whistles the most fouls.
These are season rates over one season. A player’s rate against a specific opponent can differ, and a short run of high counts says little on its own (see why “8 of the last 10” can mislead).
How do you price a duel? A worked example
Here is the method end to end with two real 2025/26 profiles: Lyon’s left winger Afonso Moreira, fourth-highest on the foul-winners list among wingers, and Strasbourg right-back Guéla Doué, whose side of the pitch Moreira attacks when Lyon play Strasbourg.
| 2025/26 | Moreira (Lyon, left winger) | Doué (Strasbourg, right-back) |
|---|---|---|
| Key rate per 90 | 2.90 fouls won (avg 1.58) | 1.83 fouls committed (avg 1.09) |
| Starts with 2+ | 76% won (avg 36%) | 43% committed (avg 25%) |
| Starts with 3+ won | 48% | – |
| Starts booked | – | 13% (avg 16.8%) |
| Minutes per start | 88.0 | 88.5 |
| Starts | 21 | 23 |
Source: Fobal data, 2025/26, 7 competitions, players with 1,800+ minutes. Avg = the role average (per 90: all appearances; shares: starts).
Read across the duel, one market at a time:
- Moreira over 1.5 fouls won is the strongest angle. He reached two in 76% of his starts, and the man in front of him fouls 1.7 times as often as an average right-back. Fair odds for 76% are about 1.31 (illustrative, no margin), so the bet only works if the price is longer than that.
- Doué over 1.5 fouls committed is a live second angle: 43% on his own record, facing a winger who draws fouls 1.8 times as often as the average left winger.
- Doué to be booked is the weakest. He fouls a lot but was booked in only 13% of his starts, below the right-back average. Fouls and cards are different markets, even for the same player.
Two checks before any of it. These records rest on 21 and 23 starts, and Moreira won at least one foul in every one of them, which won’t last: a short sample flatters any record. And both players usually finish matches (88 minutes per start), so a team-news change to either side’s shape or minutes changes the whole read.
Do fouls won lead to opponent cards?
At team level, clearly. Group every team-match by how many fouls the team won, and the opponent’s bookings climb with it:
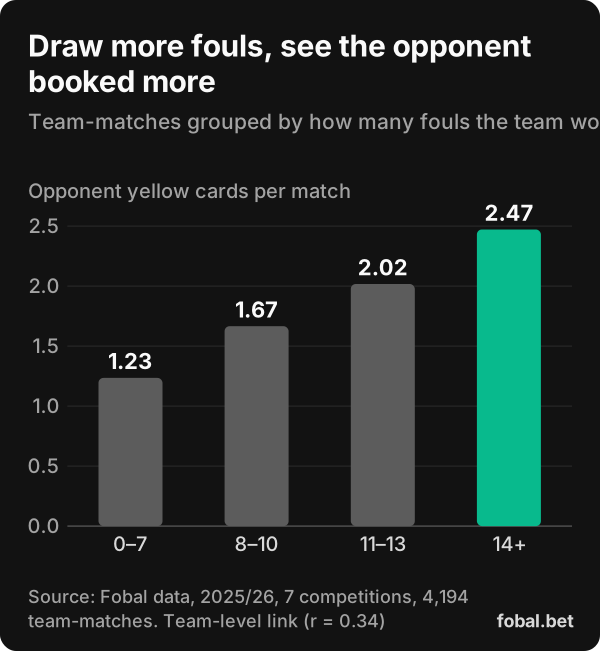
Teams that won 14 or more fouls saw their opponents collect 2.47 yellows on average, against 1.23 when they won seven or fewer. The correlation is 0.34. This is a team-level relationship, not proof that one foul-winner gets a particular defender booked. Still, it supports the logic of pairing a high foul-winner with a card bet on the player marking him, provided that player starts and stays on the pitch. Most cards come late (see our guide to how cards really happen).
How do league, role and game state change the numbers?
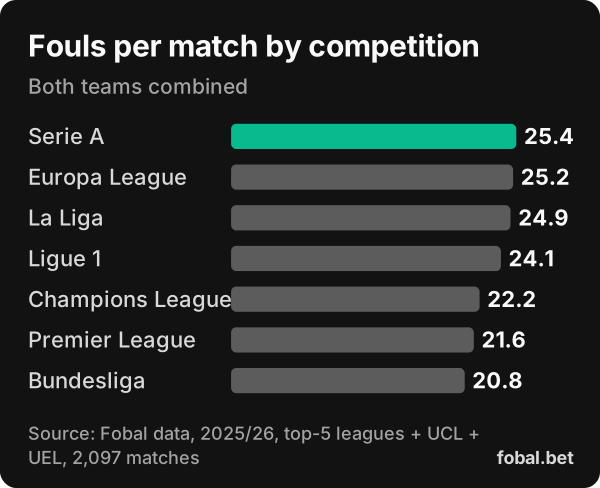
League. A Serie A match averages 25.4 fouls, a Bundesliga match 20.8: about 22% more fouls in Italy. Per team that is 12.7 against 10.4 a match. The same player profile produces more fouls in Serie A, La Liga or the Europa League than in the Premier League or the Bundesliga. Serie A also books the fewest players per foul, which is why it leads for fouls but not cards. The full comparison is in our league guide for player props.
Role within the team. A winger asked to stay wide and isolate the full-back gets more one-on-ones than one who drifts inside. A centre-forward in a direct, long-ball side spends the match in contact with centre-backs. Check how the player is used, not just the position on the team sheet.
Venue. The home and away gap is small for fouls: 11.6 per home team against 11.9 per away team. Don’t lean on it.
Game state and minutes. A team chasing a game commits fouls to win the ball back; a team protecting a lead commits tactical fouls to stop counters. Neither helps if your player is substituted. Starters who come off go at a median of minute 72 in our data, so expected minutes are part of every fouls line.
The referee. Some referees let play flow and play advantage often, which cuts recorded fouls on both sides. Fobal’s database doesn’t link referees to matches, so we can’t quantify this. Use the referee as a light adjustment, not a reason to bet.
Fouls committed and fouls won checklist
- Read the settlement rules. Must the player start? Which data provider settles the bet?
- Confirm the start and estimate minutes. A likely early substitution cuts the count.
- Set the role baseline. Wingers win about 1.5 per 90; centre-backs win 0.67. Centre-forwards commit 1.46.
- Adjust for the league. Serie A, the Europa League and La Liga run 24–25 fouls a match; the Premier League and the Bundesliga under 22.
- Identify the direct opponent. Which full-back, midfielder or centre-back does he face most?
- Check both rates in the duel. High winner vs high committer is the strongest setup for either side.
- Think about game state. Who is likely to have the ball, and who will chase the game?
- Look for the knock-on card. If your winger draws fouls, the man marking him is a booking candidate.
- Compare with the price. Starters commit at least one foul in 56.1% of starts, so a 0.5 line at short odds needs a clearly above-average player. Fair odds for a 56.1% chance are about 1.78 (illustrative, no margin).
If you use Fobal, the stat leaders rank players on fouls committed and fouls won, and each player’s match log shows them start by start, which covers steps 3 and 6 quickly. For the wider market list, see our complete guide to football player props.
A note on the data
All figures are 2025/26 averages for the Premier League, La Liga, Serie A, the Bundesliga, Ligue 1, and the Champions League and Europa League from the league phase to the semi-finals. The final round of three leagues and both European finals are missing, so we quote rates, not season totals. Fouls committed and fouls won are player statistics; league fouls per match come from team statistics. Position is the player’s season role, with wingers counted as forwards in group figures. One season of data is a limited sample, so small gaps between players or leagues can move. Bet only what you can afford to lose; our guide to responsible betting for player prop bettors has the help resources.
Frequently asked questions
What counts as a foul committed in player props?
Under the Opta definitions used by bookmakers such as Sky Bet, a foul committed is an infringement penalised by the referee with a free kick or penalty. Offsides don’t count, and when the referee plays advantage no foul is credited.
What counts as a foul won?
A foul won is credited when a player wins a free kick or penalty for his team after being fouled. There is no foul won for a handball, a dive, a back pass, an illegal restart, dissent or obstruction under the Opta definitions.
Which players win the most fouls?
Wingers and attacking midfielders. In 2025/26 Fobal data, left wingers won 1.58 fouls per 90 and right wingers 1.50. Among players with 1,800+ minutes, Nicolò Cambiaghi (Bologna) led with 4.37 per 90, ahead of Mattia Zaccagni (3.49) and Johan Manzambi (3.32).
Which positions commit the most fouls?
Centre-forwards, at 1.46 fouls per 90, then central and defensive midfielders (1.33 and 1.31). Full-backs commit only about 1.05 to 1.09 per 90, so an aggressive full-back has to be identified player by player.
Do fouls bets void if the player is a substitute?
At some bookmakers, yes. Kambi’s sportsbook terms (version 2.2, September 2026) require the player to start for pre-match disciplinary bets, including number of fouls. Other bookmakers only void if the player doesn’t play. Check your bookmaker’s rules.
Which league has the most fouls?
Serie A, with 25.4 fouls per match in 2025/26, ahead of the Europa League (25.2) and La Liga (24.9). The Bundesliga had the fewest at 20.8 per match.